Analyse data
Make sense of responses across companies and periods
Once responses are collected, analyse data feature helps you move from raw submissions to something you can actually review and compare. You can review results by recipient, by question, or across reporting periods—without relying on spreadsheets or manual reconciliation.
How analyse data works
Analyse data
Review results and compare responses
Analyse helps you review questionnaire responses and compare results across recipients and reporting periods. It gives you clear views of the data without manual calculations or spreadsheets.
Results by recipient
See each respondent’s data clearly
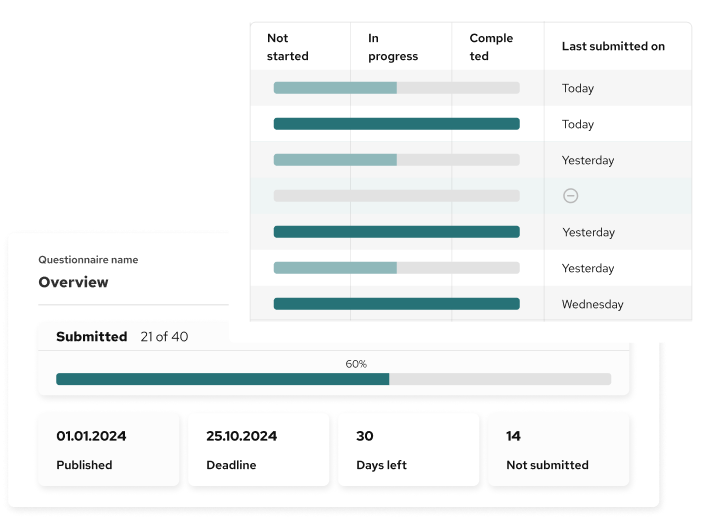
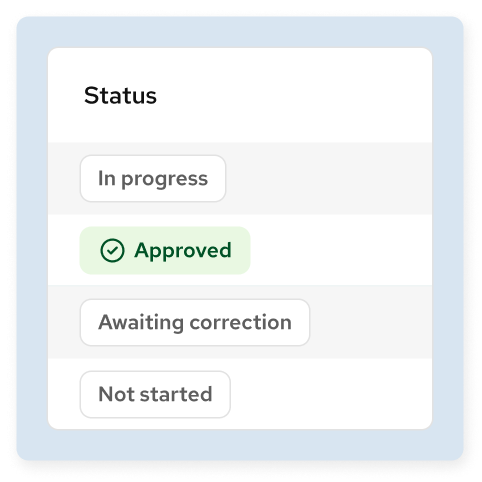
View results for each recipient in one place. You can quickly see which responses are approved, which need correction, and which are still under review. Open a recipient to see their answers in detail.
Results by question
Compare answers to the same question
Switch to a question view to see how different recipients answered the same question. This makes it easier to spot differences, missing data, or unusual values.


Compare reporting periods
See what changed
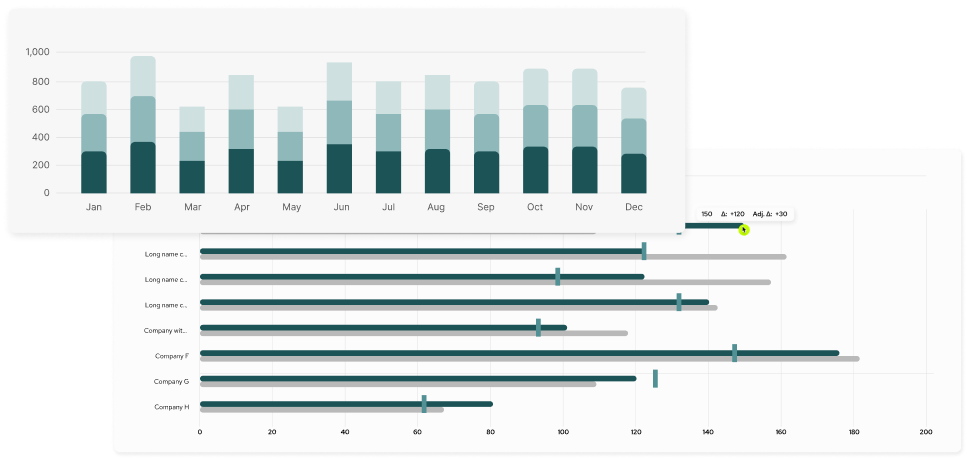
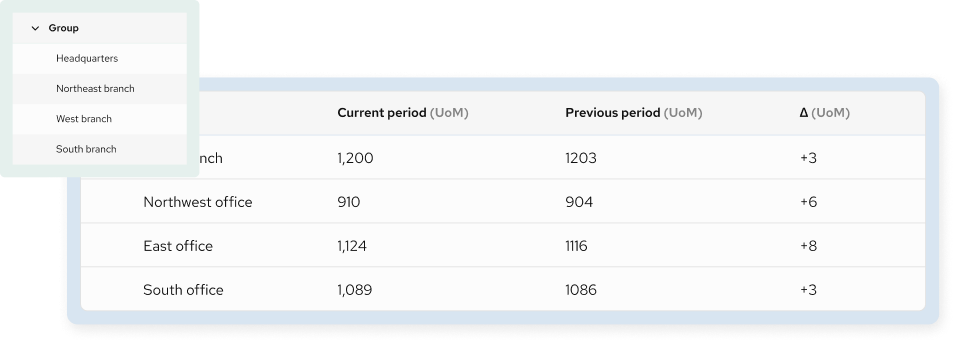
Analyse shows current and previous period values side by side. Differences are calculated automatically, so you can quickly see increases or decreases without extra work.
Analyse by scope
View totals or detailed breakdowns
When reporting scope is defined, you can analyse results at total level or break them down by entity or branch. This supports both high-level review and detailed checks.
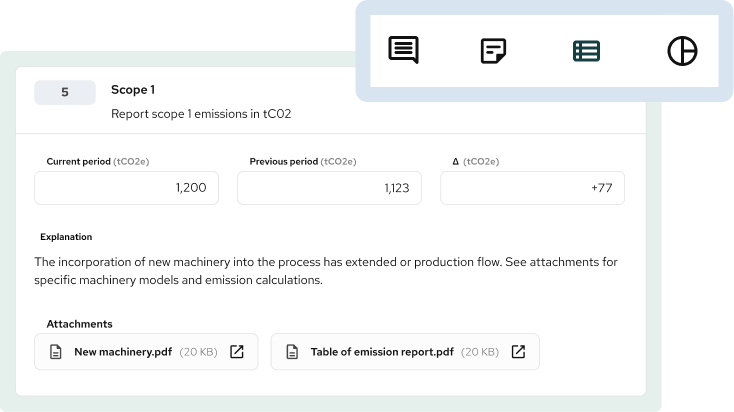
Explanations and documents
Understand the data behind the numbers
Each response can include explanations and attachments. This helps reviewers understand how values were calculated and reduces follow-up questions.
Review and approve data
Control what moves forward
You can approve responses when they are complete or request corrections when something is missing or unclear. Only reviewed data moves to the next step.
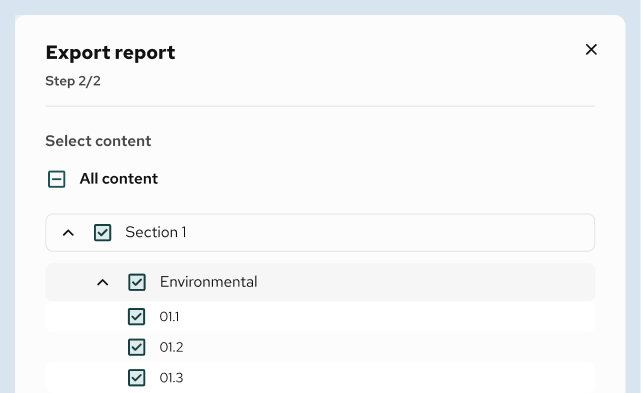
Export results
Use data outside the platform
Export analysed results for reporting, sharing, or further processing, while keeping a clear link to the original responses.
The better way analyse data
Save time, improve data collection, and reduce costs
with automatic distribution.

Questions related to analyse features on QB-EDGE™
What can I analyse on this page?
You can analyse questionnaire results by recipient, by question, and across reporting periods. This helps you review data from different angles without exporting it first.
Who are “recipients” in the analysis view?
Recipients are the people or organisations that submitted responses. Depending on your setup, this can include companies, entities, branches, or internal teams.
Can I compare results between reporting periods?
Yes. You can view current and previous period values side by side. Differences are calculated automatically so changes are easy to see.
Can I analyse data at branch or entity level?
Yes. If reporting scope is defined, you can switch between total results and detailed breakdowns by entity or branch.
Can I see explanations and supporting documents?
Yes. Explanations, comments, and attachments are shown alongside the reported values, so you can understand how the data was produced.
How do approvals and corrections work in Analyse?
You can approve responses when they are complete or request corrections if something is missing or unclear. This helps ensure only reviewed data moves forward.
Can multiple people review the data?
Yes. Multiple users can review responses, leave comments, and approve or request corrections, depending on their access rights.
Can I export the analysed results?
Yes. You can export analysed data for reporting, sharing with stakeholders, or further work outside the platform.