UtilityIQ
Turn complex utility billing into clear, actionable insights powered by AI Document Intelligence.
Download UtiliyIQ One-pager (PDF)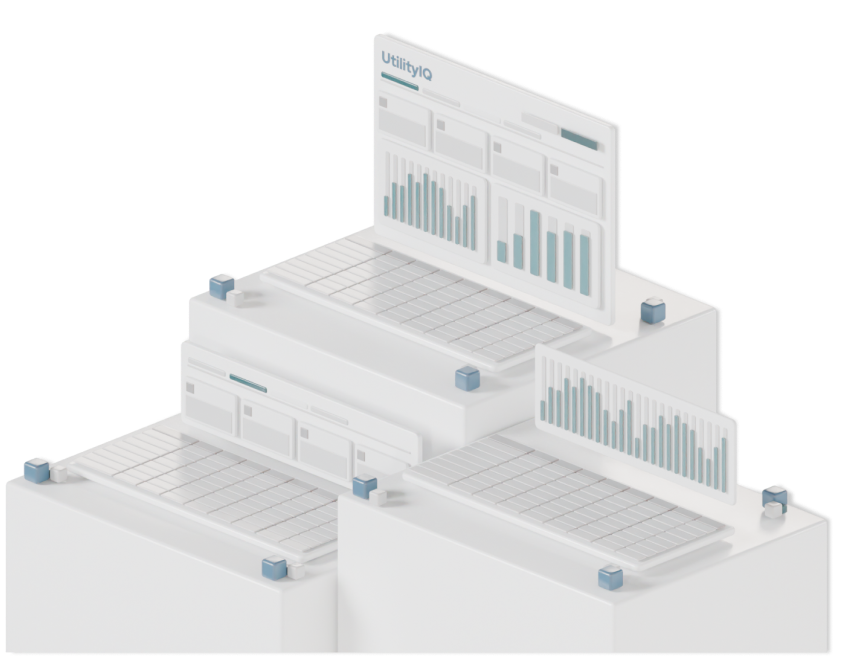

Control your energy costs. Detect inefficiencies. Act faster.
GIG UtilityIQ consolidates all your electricity, water, gas, and other utility data into one powerful analytics platform. Using advanced AI to automatically extract, standardise, and analyse invoices, we give you the clarity to make better decisions without the manual work.
Why GIG UtilityIQ?
Built for the real challenges of utility data management
Managing utilities across sites, regions, and providers is complex. Data comes in different formats, errors creep in, and insights arrive too late to act.
GIG UtilityIQ solves these problems and:
- Consolidate invoices and consumption data from all providers
- Standardise units, currencies, and formats
- Highlight anomalies in cost and consumption
- Provide instant, visual performance benchmarks
Key features

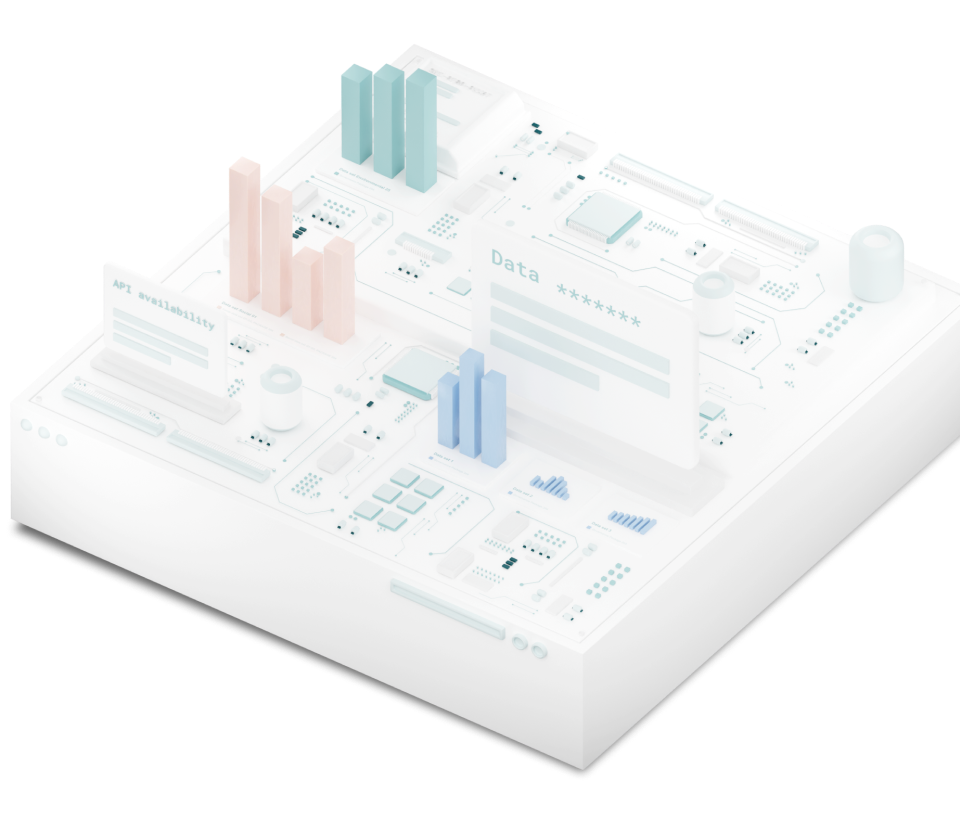
AI document intelligence
Built on Microsoft Azure AI, our system reads invoices like a human but faster. It extracts text, tables, key-value pairs, and layouts accurately, even from diverse document formats.

Automated conversions & calculations
Convert units, currencies, and reporting periods automatically, so you can compare like-for-like across locations and suppliers.

Real-time anomaly detection
Spot cost spikes, unusual consumption patterns, and data inconsistencies instantly and take action before costs escalate.

Normalised energy performance
See fair comparisons between sites, months, and providers with performance normalisation that accounts for usage differences.

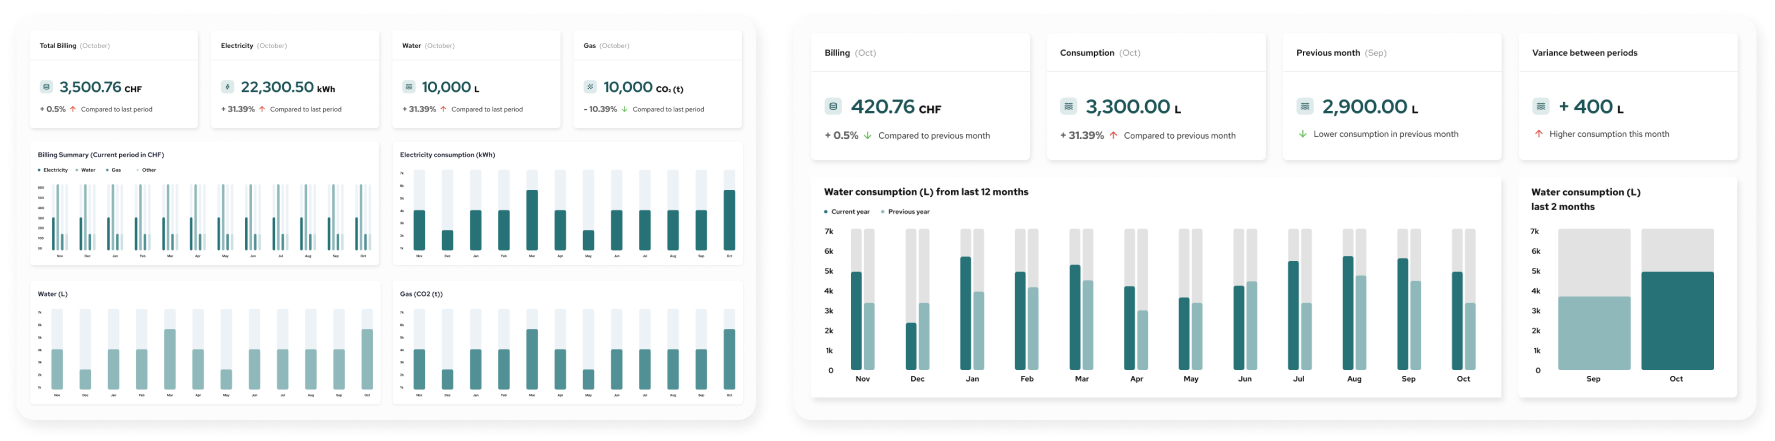
Visual, interactive dashboards
Track 12-month trends, compare current vs. previous periods, and drill down into any utility type — all in one intuitive interface.
The benefits you’ll notice immediately
- One source of truth – Centralises all invoices, KPIs, and consumption data
- Prevent human error – AI-powered extraction ensures accuracy
- Automatic unit conversions – Built-in automation for units and calculations
- Efficient pattern recognition – AI highlights anomalies and variances instantly
- Clearer decisions – Normalised KPIs allow fair comparison across assets

Who it’s for

Facility & energy managers
– reduce costs and improve operational efficiency

Sustainability teams
– access accurate, structured data for ESG reporting

Finance departments
– verify billing accuracy and budget more effectively

Portfolio managers
– monitor multiple locations from one central dashboard
Designed for scale
From a single site to an international portfolio, GIG UtilityIQ adapts to your operations. Use it for:
- Corporate offices
- Manufacturing sites
- Retail networks
- Hospitality & real estate portfolios

See GIG UtilityIQ in action
Get started today.
Discover how GIG UtilityIQ can reduce your costs, improve efficiency,
and give you total control over your utility data.