Beyond the Dashboard:
Why Data Architecture defines ESG Success
Templates and dashboards are easy to build. What’s hard is the architecture underneath: the part that makes sure data is right before it reaches a report. That’s what we spent our time on.
Data collection
The hardest part of ESG reporting isn’t the report itself: it’s getting the data. Questionnaires with built-in tracking, file uploads, API ingestion, delegated collection to portfolio company CFOs, site managers, consultants. Central oversight of what’s submitted, pending, and overdue.
You don’t adapt to our collection model. We adapt to yours.
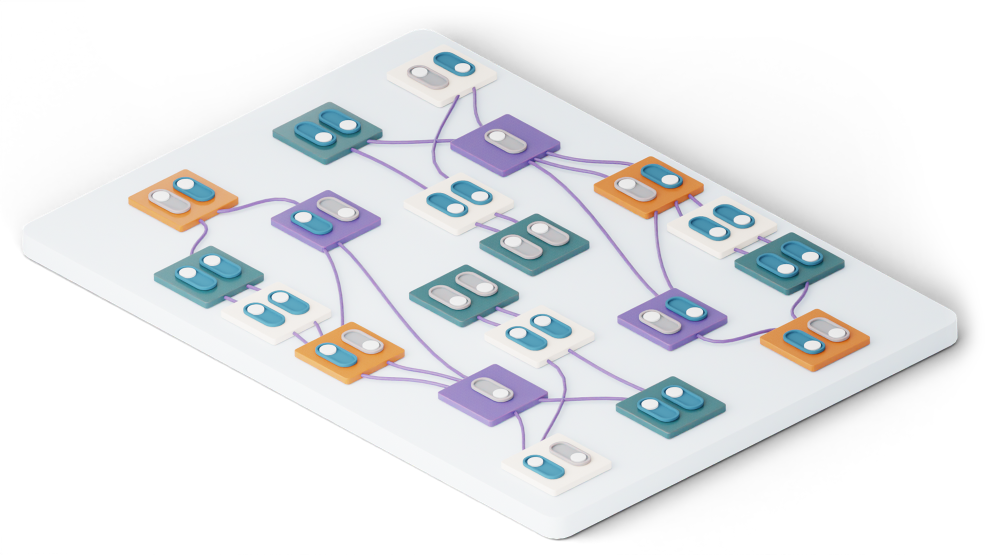
Entity structures and delegation
Data flows upward: from portfolio companies to funds, from funds to holdings, from holdings to group-level disclosures. Each level has different people, permissions, and obligations. Define your hierarchy with many-to-many relationships. Delegate collection at each level.
Control aggregation upward.
Data storage and retrieval
ESG data is evidence: policy documents, board minutes, supplier certifications, calculation methodologies. Storage handles structured data, files, images, and large datasets. Direct integration with reporting tools, no preparation step.
Consistent performance at scale, including during peak reporting cycles.
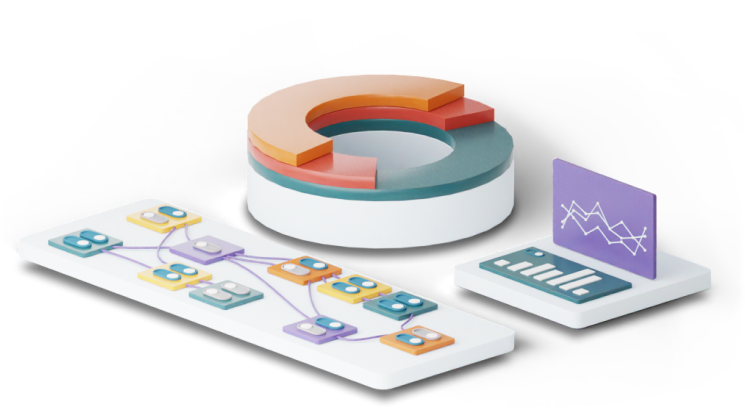
What you can do with every data point
25+ actions across five stages, from collection through to extraction and reporting.
Collect and input
Upload
Request info
Set deadline
Historical data
Organise and structure
Label
Pin
Workspace
Libraries & links
Collect and input
Assign
Comment
Review
Verify
Connect and map
Interoperability
Connect DMA
Add to SDGs
Action plan
Extract and report
PRISM extracts structured disclosure data from documents, maps it to framework requirements, and feeds it into your reporting workflows: the bridge between unstructured evidence and auditable disclosures.
Interoperability bridge
Data collected here flows into every framework that needs it
Interoperability across ESRS, GRI, SFDR, and ISSB at disclosure level: between frameworks and between questionnaires.

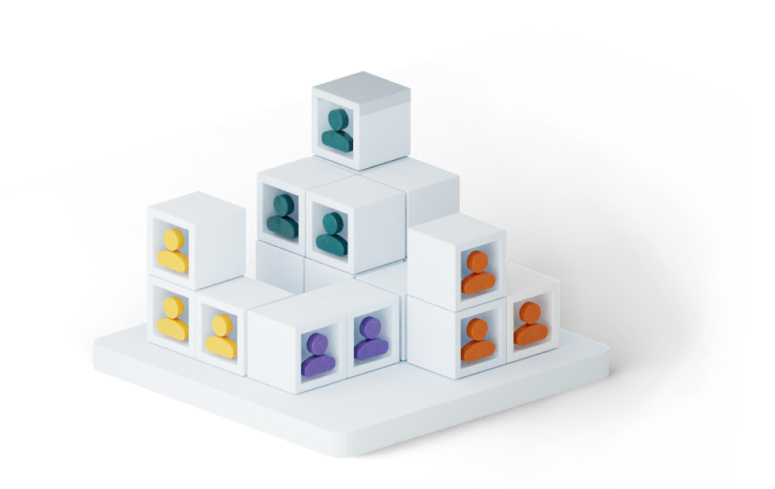
Built for
Asset managers,
collecting PAI data across portfolio companies with different reporting capacities
Enterprises,
preparing CSRD disclosures across subsidiaries and value chain partners
Fund Administrators,
consolidating SFDR reports across complex fund structures
Impact investors,
tracking performance metrics across diverse portfolios and geographies
Marketplace platforms,
aggregating ESG data from listed companies, structured and comparable
Questions related to Data Management
Why is ESG data management different from general data management?
ESG data carries a different burden from operational or financial data. Every figure must be auditable, traceable to its source, and mapped to regulatory definitions that change from one reporting cycle to the next.
The data itself is harder to govern. Much of it originates outside the organisation, from suppliers, utility providers, third-party data vendors, and field measurements. A significant share is qualitative, covering policies, processes, and narrative disclosures. Estimates and proxies are common wherever direct measurement is impractical.
The regulatory layer adds a second dimension. Standards issued by the ISSB, the European Commission, GRI, and a growing number of national regulators each define metrics in their own way, often requesting the same underlying figure under different specifications and reporting boundaries. Without a structured approach to provenance and mapping, organisations end up rebuilding the same dataset for each disclosure.
The output of ESG data management is therefore not a report. It is something a regulator, an auditor, or an investor can interrogate.
Which regulatory frameworks does the platform support?
The platform supports the frameworks driving sustainability disclosure across the major capital markets, including the ISSB standards (IFRS S1 and S2), GRI, CSRD and the ESRS, SFDR, and the EU Taxonomy.
Coverage extends beyond the standards themselves to the relationships between them. A single data point, such as Scope 1 emissions, board composition, or revenue alignment with sustainability criteria, typically appears across multiple frameworks under different definitions. The platform maintains those mappings, so data collected for one disclosure can be reused for others without manual reconciliation.
Because many national regimes build on the same foundations, including the United Kingdom’s Sustainability Disclosure Requirements, the Singapore Exchange’s climate reporting rules, and climate disclosure regulations introduced in California, the underlying data flows across jurisdictions through the international standards already supported. Mappings are updated as definitions change, which lowers the cost of compliance from one cycle to the next.
Can it handle complex organisational structures?
Yes. The platform is built for multi-entity groups, multi-fund asset managers, and the holding structures beneath them.
Reporting boundaries can be configured at any level: entity, fund, sub-fund, holding, business unit, or geography. Data can be rolled up or broken down without losing the lineage of the underlying figures. This matters wherever consolidation rules determine the perimeter of a disclosure, from asset managers reporting principal adverse impacts from holding to fund level, to global groups producing consolidated climate disclosures across subsidiaries and joint ventures.
Access controls follow the structure of the organisation. Data owners enter and validate figures within their remit. Reviewers and approvers see what they are accountable for. Group-level users consolidate across the hierarchy. The model mirrors how reporting responsibility is allocated in practice, rather than imposing a single workflow on every user.
How does the platform integrate with existing systems?
Integration is built on APIs, structured file imports, and connectors to the systems where data already lives, including ERP, accounting, HR, energy management, supplier portals, and third-party ESG data providers.
The platform complements existing infrastructure rather than replacing it. Organisations that have invested in financial systems, data warehouses, or governance tools can connect those sources directly. The platform handles extraction, validation, and mapping to disclosure frameworks.
The Data Flow and Interoperability Builder, a platform-level capability, allows users to define how information moves from source systems through transformations to final disclosure. Each path is documented and repeatable, supporting both internal controls and external assurance. Exports are produced in the formats regulators, auditors, and partners require, including XBRL, machine-readable data files for digital reporting, and the standard templates used by ratings agencies and investor questionnaires.
Why choose Generation Impact Global over other ESG Tech platforms?
Generation Impact Global was built by people whose starting point is the regulation, not the software. Founded in Geneva and operating internationally, the company combines regulatory expertise in CSRD, SFDR, the EU Taxonomy, and the ISSB standards with engineering focused on the technical demands of disclosure.
That orientation shapes the product. Multi-framework mapping is treated as a core capability rather than an add-on. Audit trails, role-based controls, and data lineage are designed for assurance from the outset. The platform serves financial institutions, enterprises, SMEs, and marketplaces under a single architecture, which avoids the fragmentation that occurs when separate tools are stitched together.
Two further considerations are practical. The company is independent and founder-led, with product decisions driven by client needs. And the scope of the platform, covering reporting, impact, data, governance, and supply chain, is deliberately focused on ESG rather than appended to a broader software suite where sustainability is one module among many.
For organisations selecting a platform now, the questions worth putting to any vendor are consistent. How current is the regulatory mapping. How is data lineage handled. Who is accountable for accuracy within the system. The platform is built to answer those questions directly.