
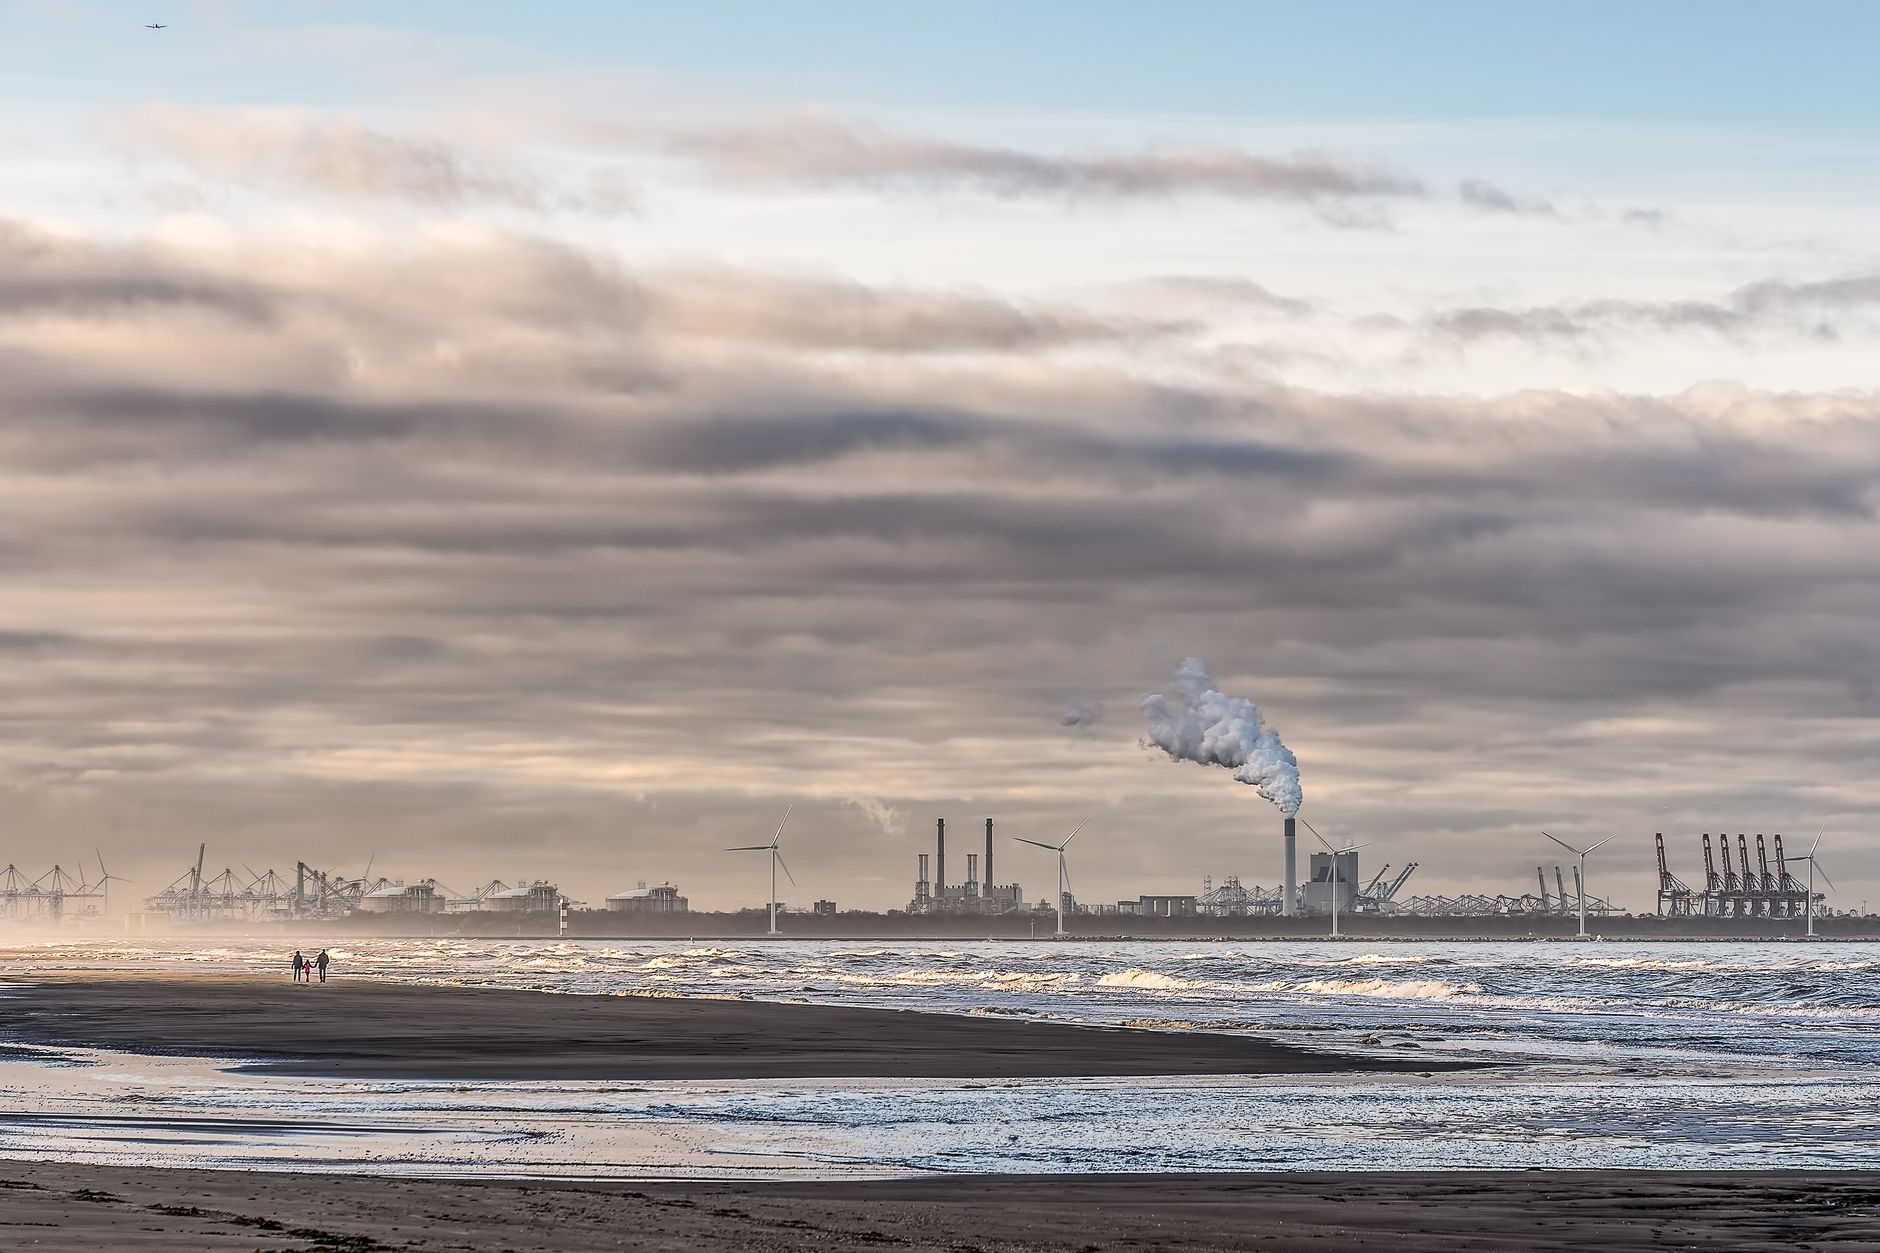
Global greenhouse gas emissions reached a record 54 gigatonnes of CO2 equivalent in 2025 excluding land use, rising 0.7% from 2024. While six of the 16 major global emitters achieved reductions, total global emissions continued an upward trend.
Shifting Emission Trends Across Major Global Economies
The six largest global emitters, comprising China, the United States, India, the European Union, Russia, and Indonesia, accounted for 62% of total greenhouse gas emissions in 2025. Emission trajectories varied significantly among these key economies.
The United States recorded the largest absolute increase worldwide with a 2.2% rise compared to 2024. In contrast, China and India maintained or reduced their emission levels, recording changes of +0.1% and -0.2% respectively. Six of the 16 major emitting nations that each contribute over 1% of global emissions achieved reductions in 2025, including Australia, Brazil, Japan, and the European Union.
The European Union reduced its greenhouse gas emissions excluding land use by 0.2% relative to 2024, bringing its total reduction to 35.6% below 1990 levels. Türkiye recorded the highest relative increase among major emitters at +4.2%, alongside notable rises in Iran and Saudi Arabia. International transport emissions also increased, with aviation rising 5.1% and maritime shipping expanding 1.4%.
Impact of Land Use, Deforestation, and Wildfires
The land use, land-use change, and forestry sector acted as a net source of approximately 0.9 gigatonnes of CO2 equivalent globally in 2025, representing 1.6% of global greenhouse gas emissions. Carbon removal mechanisms experienced significant pressure during the year.
Deforestation released 3.7 gigatonnes of CO2, offsetting more than double the amount absorbed by global land use sinks. Meanwhile, wildfires generated 2.2 gigatonnes of CO2 equivalent emissions worldwide. Although global wildfire emissions remained below the long-term historical average, regional spikes occurred. In the European Union, net forest carbon removals fell compared to 1990 levels, partly due to a 40% increase in regional wildfire emissions from 2024 to 2025.
Role of the EDGAR Dataset in Climate Policy
The Emissions Database for Global Atmospheric Research, managed by the Joint Research Centre in cooperation with the International Energy Agency, provides comparative emissions data spanning 1970 to 2025. This independent scientific output informs European Union policy initiatives, including the Competitive Compass and the Clean Industrial Deal.
Data from the database supports international climate negotiations under the United Nations Framework Convention on Climate Change. It also serves as an input for the annual UNEP Emissions Gap Report, Intergovernmental Panel on Climate Change assessment reports, and the IPCC Task Force on National Greenhouse Gas Inventories.
| Country or Region | 2025 Emission Change vs 2024 | Key Characteristics |
|---|---|---|
| Stati Uniti | +2.2% | Largest absolute global increase |
| Cina | +0.1% | Maintained level for the first time |
| India | -0.2% | Reduced emission level for the first time |
| Unione europea | -0.2% | Down 35.6% from 1990 levels; 5.8% global share |
| Türkiye | +4.2% | Highest relative increase among major emitters |
Domande frequenti
How much did global greenhouse gas emissions grow in 2025?
Global emissions reached a record 54 gigatonnes of CO2 equivalent in 2025 excluding land use, representing a 0.7% increase compared to 2024.
Which major economies reduced their emissions in 2025?
Six of the 16 major global emitters reduced emissions in 2025, including Australia, Brazil, India, Japan, and the European Union.