
Sustainable Development Goals (SDGs)
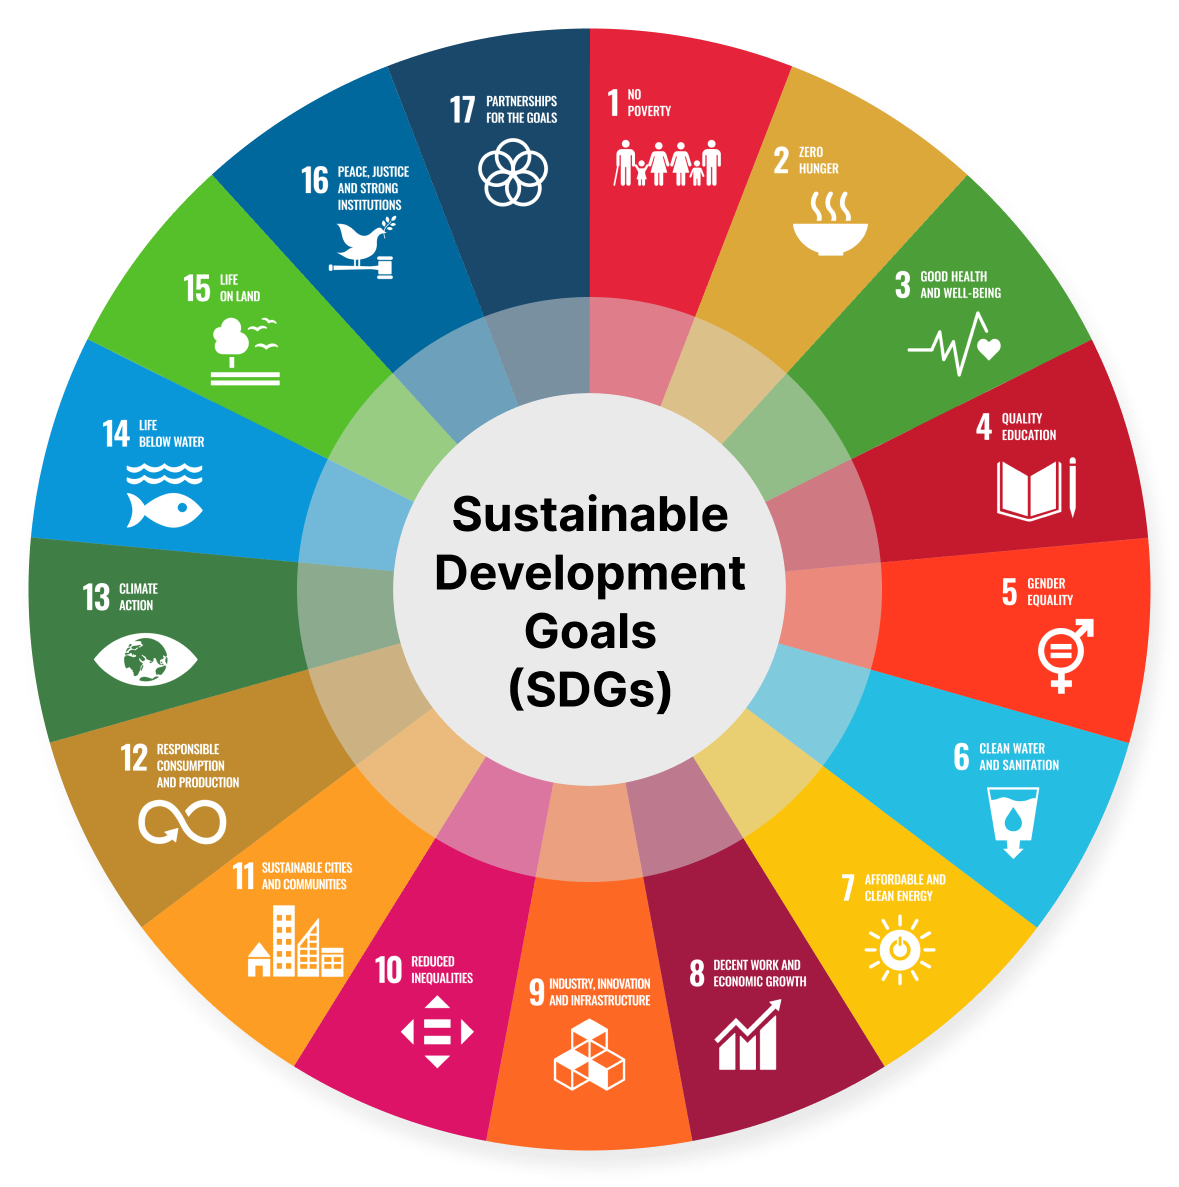
The Sustainable Development Goals represent a universal call to action to end poverty, protect the planet, and ensure that by 2030 all people enjoy peace and prosperity. These global objectives, often referred to simply as the SDG goals, provide a shared blueprint for peace and prosperity for people and the planet, now and into the future.
For modern businesses, understanding and integrating the 2030 sustainable development goals is no longer just a matter of philanthropy. It is a core component of resilient corporate strategy. By framing business operations around these global benchmarks, companies can effectively align their Environmental, Social, and Governance (ESG) initiatives with recognized international standards. This alignment helps organizations manage risks, uncover new market opportunities, and demonstrate measurable, sustainable impact to investors, regulators, and consumers.
Time on the clock
Days left until the 2030 deadline. The agenda was adopted in September 2015, which puts us past the three-quarter mark with the hardest goals still behind schedule.
Goals, adopted by all 193 UN Member States
Targets sitting beneath the goals
Unique indicators after the 2025 comprehensive review, up from 231
Pillars: people, planet, prosperity, peace, partnership
Where this leads
The same figure that proves an SDG claim is the figure your CSRD filing, your investors’ SFDR templates and your customer questionnaires all ask for.
What are the Sustainable Development Goals?
A universal agenda, negotiated by states, now used as infrastructure by markets.
The Sustainable Development Goals are a set of 17 objectives agreed by the United Nations General Assembly in September 2015 in the resolution Transforming our world: the 2030 Agenda for Sustainable Development. All 193 Member States signed up to them, which is what gives the framework its unusual reach: the same 17 goals apply to a low-income economy and to a listed multinational, and both are expected to move on them by 2030.
They replaced the Millennium Development Goals, which ran from 2000 to 2015 and applied mainly to developing countries. The goals of sustainable development set out in the 2030 Agenda are deliberately universal, indivisible and integrated: progress on clean water depends on progress on climate, which depends on progress on energy and industry. Cherry-picking two convenient goals and calling it alignment misses how the framework is designed to work.
Pillar 01 · Goals 1–5
People
Dignity and equality: poverty, hunger, health, education and gender. The pillar where most social reporting under ESRS S1 to S4 lands.
Pillar 02 · Goals 6, 12–15
Planet
Water, consumption, climate, oceans and land. Maps onto the six environmental objectives of the EU Taxonomy almost one for one.
Pillar 03 · Goals 7–11
Prosperity
Energy, work, industry, inequality and cities.
Pillar 04 · Goal 16
Peace
Justice, anti-corruption and accountable institutions.
Pillar 05 · Goal 17
Partnership
The finance, technology, trade and data that make the other 16 deliverable.
Why the framework holds commercial weight
The SDGs are the only impact taxonomy that governments, development banks, investors, rating agencies and corporate clients all recognise. That shared vocabulary is why SDG alignment now appears in procurement criteria, sustainable finance documentation and fund prospectuses, not because the goals are legally binding on companies, but because they are the reference everyone already reads.
The 17 Sustainable Development Goals: Full List
How many Sustainable Development Goals are there? There are 17 SDG goals in total, agreed by every UN member state. Here’s the complete SDG list, in order:
In each goal’s “Typical reporting overlap”: ESRS codes per ESRS (2026), Delegated Regulation (EU) 2026/1563. GRI 102 (Climate Change) and GRI 103 (Energy) replace GRI 305 and GRI 302 from 1 January 2027.
- No Poverty: End poverty in all its forms, everywhere.
- Zero Hunger: End hunger, achieve food security and promote sustainable agriculture.
- Good Health and Well-being: Ensure healthy lives and promote well-being for all, at every age.
- Quality Education: Ensure inclusive, equitable education and promote lifelong learning opportunities.
- Gender Equality: Achieve gender equality and empower all women and girls.
- Clean Water and Sanitation: Ensure availability and sustainable management of water and sanitation for all.
- Affordable and Clean Energy: Ensure access to affordable, reliable, sustainable and modern energy.
- Decent Work and Economic Growth: Promote sustained, inclusive economic growth and decent work for all.
- Industry, Innovation and Infrastructure: Build resilient infrastructure and promote sustainable industrialisation and innovation.
- Reduced Inequalities: Reduce inequality within and among countries.
- Sustainable Cities and Communities: Make cities and human settlements inclusive, safe, resilient and sustainable.
- Responsible Consumption and Production: Ensure sustainable consumption and production patterns.
- Climate Action: Take urgent action to combat climate change and its impacts.
- Life Below Water: Conserve and sustainably use the oceans, seas and marine resources.
- Life on Land: Protect, restore and promote sustainable use of terrestrial ecosystems.
- Peace, Justice and Strong Institutions: Promote peaceful, inclusive societies and effective institutions.
- Partnerships for the Goals: Strengthen the means of implementation and revitalise global partnership.
Exploring Each of the 17 SDGs in Detail:
Filter the SDG goals list by pillar
Goal 1 · People
Sustainable Development Goal 1: No Poverty
Goal 1 aims to end poverty in every form, everywhere. It covers extreme income poverty, poverty measured against national definitions, access to social protection systems, secure rights to land and property, and resilience to the economic, social and climate shocks that push households back below the line.
Where organisations act
- Living-wage analysis across own operations and first-tier suppliers
- Financial inclusion and affordability of products in emerging markets
- Community investment and resilience programmes in operating regions
Targets under this goal
7 of the 169 targets, 5 outcome and 2 means of implementation.
Typical reporting overlap
ESRS S1 and S2, GRI 202 and GRI 411
Worked example: from goal to a number you can report
Target
1.2 Halve the proportion of people living in poverty in all its dimensions according to national definitions.
Global indicator
1.2.1 Proportion of the population living below the national poverty line.
Corporate proxy what you actually measure.
Living-wage gap: the share of employees and contracted workers paid below a credible local living-wage benchmark, disclosed by country.
Goal 2 · People
Sustainable Development Goal 2: Zero Hunger
Goal 2 addresses hunger, food security, nutrition and sustainable agriculture. Its targets cover access to safe and sufficient food, all forms of malnutrition, the productivity and incomes of small-scale food producers, resilient agricultural practice, and the genetic diversity of seeds and livestock.
Where organisations act
- Agricultural sourcing standards and smallholder supplier programmes
- Food loss and waste measurement across processing and distribution
- Nutritional profile and affordability of consumer food products
Targets under this goal
8 of the 169 targets, 5 outcome and 3 means of implementation.
Typical reporting overlap
ESRS E4 and S2, GRI 13 (agriculture sector standard)
Worked example — from goal to a number you can report
Target
2.4 Ensure sustainable food production systems and resilient agricultural practices.
Global indicator
2.4.1 Proportion of agricultural area under productive and sustainable agriculture.
Corporate proxy — what you actually measure
Share of agricultural raw material volume sourced from suppliers certified against a recognised sustainable-agriculture scheme, by commodity.
Goal 3 · People
Sustainable Development Goal 3: Good Health and Well-being
Goal 3 covers healthy lives and well-being at every age. It spans maternal and child mortality, communicable diseases, non-communicable disease and mental health, substance abuse, road traffic injuries, sexual and reproductive health, universal health coverage, and pollution-related illness.
Where organisations act
- Occupational health and safety performance, including contractor incidents
- Product safety, pharmacovigilance and responsible marketing
- Employee mental health provision and absence data
Targets under this goal
13 of the 169 targets, 9 outcome and 4 means of implementation.
Typical reporting overlap
ESRS S1-13, GRI 403, SASB health and safety metrics
Worked example — from goal to a number you can report
Target
3.9 Substantially reduce deaths and illness from hazardous chemicals and air, water and soil pollution.
Global indicator
3.9.1 Mortality rate attributed to household and ambient air pollution.
Corporate proxy — what you actually measure
Recordable incident rate and occupational exposure monitoring, plus emissions to air from sites located near residential populations.
Goal 4 · People
Sustainable Development Goal 4: Quality Education
Goal 4 is about inclusive and equitable quality education and lifelong learning. It reaches from early childhood development and free primary and secondary schooling through to technical, vocational and tertiary education, adult literacy, and the skills people need for decent work and entrepreneurship.
Where organisations act
- Training hours, apprenticeships and reskilling investment per employee
- Digital and technical skills programmes in supply-chain communities
- Education access initiatives tied to future workforce pipelines
Targets under this goal
10 of the 169 targets, 7 outcome and 3 means of implementation.
Typical reporting overlap
ESRS S1-12, GRI 404
Worked example — from goal to a number you can report
Target
4.4 Substantially increase the number of people with relevant skills for employment and entrepreneurship.
Global indicator
4.4.1 Proportion of young people and adults with information and communications technology skills.
Corporate proxy — what you actually measure
Average training hours per employee and the share completing certified technical or digital skills programmes, split by job category and gender.
Goal 5 · People
Sustainable Development Goal 5: Gender Equality
Goal 5 seeks to end discrimination and violence against women and girls, eliminate harmful practices, recognise unpaid care and domestic work, and secure full participation in leadership and equal rights to economic resources, property and technology.
Where organisations act
- Gender pay gap, by level, and representation in senior management and on the board
- Parental leave, flexible working and return-to-work retention
- Supplier diversity and procurement from women-owned businesses
Targets under this goal
9 of the 169 targets, 6 outcome and 3 means of implementation.
Typical reporting overlap
ESRS S1-8, S1-11 and S1-15, GRI 405 and GRI 406, SFDR PAI 12 and 13
Worked example — from goal to a number you can report
Target
5.5 Ensure full and effective participation and equal opportunities for leadership at all levels of decision-making.
Global indicator
5.5.2 Proportion of women in managerial positions.
Corporate proxy — what you actually measure
Gender split by management level with the level definitions disclosed, alongside the unadjusted and adjusted remuneration difference.
Goal 6 · Planet
Sustainable Development Goal 6: Clean Water and Sanitation
Goal 6 covers universal access to safe drinking water and to adequate sanitation and hygiene. It also addresses water quality and untreated wastewater, water-use efficiency and scarcity, integrated water resources management, and the protection and restoration of water-related ecosystems.
Where organisations act
- Water withdrawal and consumption in areas of high water stress
- Effluent quality and wastewater treatment across sites
- Water risk assessment for own operations and key sourcing regions
Targets under this goal
8 of the 169 targets, 6 outcome and 2 means of implementation.
Typical reporting overlap
ESRS E3, GRI 303, EU Taxonomy water objective
Worked example — from goal to a number you can report
Target
6.4 Substantially increase water-use efficiency and reduce the number of people suffering water scarcity.
Global indicator
6.4.2 Level of water stress: freshwater withdrawal as a proportion of available freshwater resources.
Corporate proxy — what you actually measure
Water withdrawal and consumption in megalitres, reported separately for sites in basins classified as high or extremely high water stress.
Goal 7 · Prosperity
Sustainable Development Goal 7: Affordable and Clean Energy
Goal 7 targets universal access to affordable, reliable and modern energy services, a substantially larger share of renewables in the global energy mix, and a doubling of the global rate of improvement in energy efficiency, supported by international cooperation and infrastructure investment.
Where organisations act
- Renewable electricity share and power purchase agreement coverage
- Energy intensity per unit of production or revenue
- Scope 2 emissions under market-based and location-based methods
Targets under this goal
5 of the 169 targets, 3 outcome and 2 means of implementation.
Typical reporting overlap
ESRS E1-7, GRI 302 (GRI 103 from 1 January 2027), EU Taxonomy climate mitigation
Worked example — from goal to a number you can report
Target
7.2 Substantially increase the share of renewable energy in the global energy mix.
Global indicator
7.2.1 Renewable energy share in total final energy consumption.
Corporate proxy — what you actually measure
Renewable share of total energy consumption, with contractual instruments disclosed separately from on-site generation so the figure is not overstated.
Goal 8 · Prosperity
Sustainable Development Goal 8: Decent Work and Economic Growth
Goal 8 combines economic growth with decent work. It covers productivity and diversification, decoupling growth from environmental degradation, full and productive employment, equal pay for work of equal value, youth employment, the eradication of forced labour, modern slavery and child labour, safe working environments, and access to financial services.
Where organisations act
- Modern slavery and forced-labour due diligence across the supply chain
- Wage practice, working-time and collective bargaining coverage
- Recordable incident rate, lost-time injuries and near-miss reporting
Targets under this goal
12 of the 169 targets, 10 outcome and 2 means of implementation.
Typical reporting overlap
ESRS S1 and S2, GRI 202, 401, 403, 407 and 409, SFDR PAI 10 and 11
Worked example — from goal to a number you can report
Target
8.7 Eradicate forced labour, end modern slavery and eliminate child labour in all its forms.
Global indicator
8.7.1 Proportion and number of children aged 5 to 17 engaged in child labour.
Corporate proxy — what you actually measure
Share of supplier spend covered by forced- and child-labour due diligence, with the number of confirmed findings and remediation outcomes.
Goal 9 · Prosperity
Sustainable Development Goal 9: Industry, Innovation and Infrastructure
Goal 9 addresses resilient infrastructure, inclusive and sustainable industrialisation, and innovation. Its targets include the share of industry in employment and GDP, access to finance for small enterprises, retrofitting industries for resource efficiency and clean technology, research and development spending, and universal access to the internet.
Where organisations act
- Resource efficiency and clean-technology capital expenditure
- Research and development intensity and low-carbon product revenue
- Infrastructure resilience assessment under physical climate scenarios
Targets under this goal
8 of the 169 targets, 5 outcome and 3 means of implementation.
Typical reporting overlap
ESRS E1 transition plan and E5, GRI 203, EU Taxonomy manufacturing activities
Worked example — from goal to a number you can report
Target
9.4 Upgrade infrastructure and retrofit industries for resource-use efficiency and clean technologies.
Global indicator
9.4.1 Carbon dioxide emission per unit of value added.
Corporate proxy — what you actually measure
Emissions intensity per unit of production or per million of revenue, disclosed alongside the absolute figure so efficiency gains cannot mask growth.
Goal 10 · Prosperity
Sustainable Development Goal 10: Reduced Inequalities
Goal 10 focuses on inequality within and between countries. It covers income growth for the bottom forty per cent of the population, social, economic and political inclusion irrespective of status, fiscal and wage policy, regulation of global financial markets and institutions, and safe, orderly and responsible migration.
Where organisations act
- CEO-to-median pay ratio and pay equity analysis
- Inclusive recruitment, promotion and retention data by demographic
- Responsible recruitment fees and migrant worker protections
Targets under this goal
10 of the 169 targets, 7 outcome and 3 means of implementation.
Typical reporting overlap
ESRS S1-15 and S3, GRI 405 and GRI 207
Worked example — from goal to a number you can report
Target
10.4 Adopt fiscal, wage and social protection policies to progressively achieve greater equality.
Global indicator
10.4.1 Labour share of GDP, comprising wages and social protection transfers.
Corporate proxy — what you actually measure
Ratio of highest-paid individual to median employee remuneration, plus the share of the workforce paid below a living-wage benchmark.
Goal 11 · Prosperity
Sustainable Development Goal 11: Sustainable Cities and Communities
Goal 11 covers cities and human settlements. Its targets address adequate, safe and affordable housing, sustainable transport systems, participatory urban planning, the protection of cultural and natural heritage, resilience to disasters, urban air quality and waste management, and access to green public space.
Where organisations act
- Building energy performance and certification across the real estate portfolio
- Urban logistics emissions and low-emission zone readiness
- Waste diversion and air quality monitoring at city-based operations
Targets under this goal
10 of the 169 targets, 7 outcome and 3 means of implementation.
Typical reporting overlap
ESRS E1, E2 and E5, GRI 305 (GRI 102 from 1 January 2027) and GRI 306, EU Taxonomy buildings
Worked example — from goal to a number you can report
Target
11.6 Reduce the adverse per-capita environmental impact of cities, including air quality and waste.
Global indicator
11.6.2 Annual mean levels of fine particulate matter in cities.
Corporate proxy — what you actually measure
Site-level emissions to air and the share of the property portfolio meeting a recognised energy-performance certification threshold.
Goal 12 · Planet
Sustainable Development Goal 12: Responsible Consumption and Production
Goal 12 is the production and consumption goal, and it is the one most directly aimed at companies. It covers sustainable management of natural resources, halving food waste, sound management of chemicals and waste, and target 12.6, which explicitly encourages companies to adopt sustainable practices and integrate sustainability information into their reporting cycle.
Where organisations act
- Material circularity, recycled input share and product end-of-life design
- Hazardous and non-hazardous waste generation and treatment routes
- Sustainability reporting itself: target 12.6 makes disclosure an SDG contribution
Targets under this goal
11 of the 169 targets, 8 outcome and 3 means of implementation.
Typical reporting overlap
ESRS E2 and E5, GRI 301 and GRI 306, CSRD reporting obligations
Worked example — from goal to a number you can report
Target
12.6 Encourage companies to adopt sustainable practices and integrate sustainability information into their reporting cycle.
Global indicator
12.6.1 Number of companies publishing sustainability reports.
Corporate proxy — what you actually measure
Publication of a sustainability statement under CSRD or GRI, with the assurance level and the reporting boundary stated explicitly.
Goal 13 · Planet
Sustainable Development Goal 13: Climate Action
Goal 13 calls for urgent action on climate change and its impacts. Its five targets cover resilience and adaptive capacity to climate-related hazards, integration of climate measures into national policy and planning, education and institutional capacity, and the finance and capacity-building commitments made under the UN Framework Convention on Climate Change.
Where organisations act
- Scope 1, 2 and 3 greenhouse gas inventory and verified reduction targets
- Climate transition plan with capital allocation and interim milestones
- Physical and transition risk assessment under multiple scenarios
Targets under this goal
5 of the 169 targets, 3 outcome and 2 means of implementation.
Typical reporting overlap
ESRS E1, GRI 305 (GRI 102 from 1 January 2027), IFRS S2, TCFD, SFDR PAI 1 to 6
Worked example — from goal to a number you can report
Target
13.2 Integrate climate change measures into national policies, strategies and planning.
Global indicator
13.2.2 Total greenhouse gas emissions per year.
Corporate proxy — what you actually measure
Verified Scope 1, 2 and 3 inventory with the consolidation approach stated, a fixed base year, and market- and location-based Scope 2 shown separately.
Goal 14 · Planet
Sustainable Development Goal 14: Life Below Water
Goal 14 concerns oceans, seas and marine resources. Targets address marine pollution including nutrient run-off and plastic debris, protection and restoration of coastal ecosystems, ocean acidification, overfishing and destructive fishing practices, marine protected areas, and harmful fisheries subsidies.
Where organisations act
- Plastic and packaging footprint, including single-use materials
- Sustainable seafood sourcing and certified fishery traceability
- Shipping and maritime logistics emissions and discharge controls
Targets under this goal
10 of the 169 targets, 7 outcome and 3 means of implementation.
Typical reporting overlap
ESRS E2, E4 and E5, GRI 304 and GRI 306
Worked example: from goal to a number you can report
Target
14.1 Prevent and significantly reduce marine pollution of all kinds, particularly from land-based activities.
Global indicator
14.1.1 Index of coastal eutrophication and floating plastic debris density.
Corporate proxy: what you actually measure
Total plastic packaging placed on the market by polymer, the recycled content share, and nutrient loads in discharged effluent.
Goal 15 · Planet
Sustainable Development Goal 15: Life on Land
Goal 15 covers terrestrial and freshwater ecosystems, forests, deserts and mountains. It targets conservation and sustainable use of ecosystems, an end to deforestation and the restoration of degraded forests, action on desertification and land degradation, protection of biodiversity and threatened species, and an end to poaching and trafficking of protected species.
Where organisations act
- Deforestation-free supply chains and commodity traceability to plot level
- Nature-related dependency and impact assessment for priority sites
- Land-use change, habitat restoration and biodiversity net gain commitments
Targets under this goal
12 of the 169 targets, 9 outcome and 3 means of implementation.
Typical reporting overlap
ESRS E4, GRI 101 and GRI 304, EUDR, TNFD
Worked example: from goal to a number you can report
Target
15.2 Halt deforestation, restore degraded forests and substantially increase reforestation.
Global indicator
15.2.1 Progress towards sustainable forest management.
Corporate proxy: what you actually measure
Share of forest-risk commodity volume traceable to plot level and verified deforestation-free, by commodity and sourcing country.
Goal 16 · Peace
Sustainable Development Goal 16: Peace, Justice and Strong Institutions
Goal 16 is about peaceful and inclusive societies. Its targets cover reduction of violence, abuse and trafficking, the rule of law and access to justice, illicit financial and arms flows, corruption and bribery in all forms, effective and accountable institutions, inclusive decision-making, legal identity for all, and public access to information.
Where organisations act
- Anti-bribery and corruption controls, training and confirmed incidents
- Whistleblowing channels, case volumes and outcomes
- Tax transparency, political engagement and lobbying disclosure
Targets under this goal
12 of the 169 targets, 10 outcome and 2 means of implementation.
Typical reporting overlap
ESRS G1, GRI 205, 206, 207 and 415
Worked example: from goal to a number you can report
Target
16.5 Substantially reduce corruption and bribery in all their forms.
Global indicator
16.5.2 Proportion of businesses that had contact with a public official and paid a bribe.
Corporate proxy: what you actually measure
Confirmed corruption incidents and actions taken, share of employees trained on the anti-bribery policy, and country-by-country tax reporting.
Goal 17 · Partnership
Sustainable Development Goal 17: Partnerships for the Goals
Goal 17 is the means of implementation. Its nineteen targets, the most of any goal, cover domestic resource mobilisation and development finance, technology transfer and innovation capacity, capacity-building, an equitable multilateral trading system, policy coherence, multi-stakeholder partnerships, and the data, monitoring and statistical capacity needed to measure everything else.
Where organisations act
- Blended finance, development finance institution partnerships and impact funds
- Industry coalitions, standard-setting participation and pre-competitive data sharing
- Data quality and statistical capacity: the reporting infrastructure itself
Targets under this goal
19 of the 169 targets, all 19 numbered, with no separate means-of-implementation targets.
Typical reporting overlap
ESRS 2 governance disclosures, GRI 2, SDG data and reporting infrastructure
Worked example: from goal to a number you can report
Target
17.16 Enhance the global partnership for sustainable development, complemented by multi-stakeholder partnerships.
Global indicator
17.16.1 Progress in multi-stakeholder development effectiveness monitoring frameworks.
Corporate proxy: what you actually measure
Named participation in industry coalitions and standard-setting bodies, with the contribution and any funded commitment disclosed.
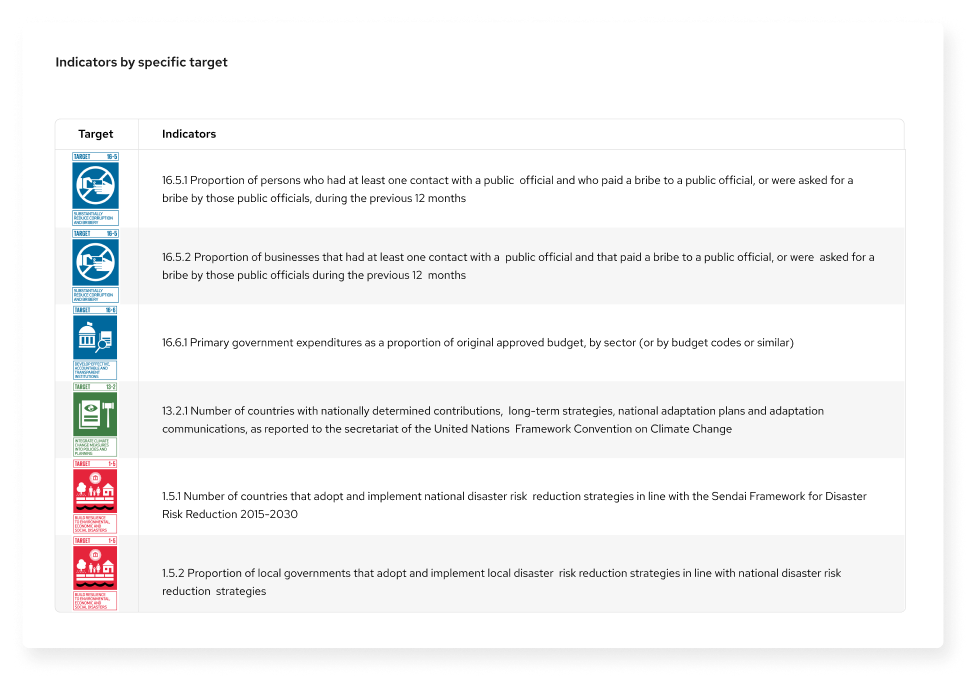
SDG Targets and Indicators
The goals are the headline. The targets and indicators are what actually gets measured.
Almost every organisation that says it “supports the SDGs” is talking about the goal layer. That layer commits you to nothing measurable. The two layers underneath it, the sustainable development goals targets and the global indicators, are where the framework becomes something you can baseline, track and put in front of an auditor. Scroll through the three levels below.
Level 01 – 17 goals
Each square is one item at that level. The framework widens sharply as you move down it.
Level 01
17 goals set the direction
The goal layer is the part everyone recognises: no poverty, zero hunger, climate action. It is deliberately broad, because it had to be agreed by 193 states with very different economies and priorities.
Breadth is the point at this level, and it is also the limitation. A commitment expressed only as a goal number cannot be audited, benchmarked or falsified. It is a statement of direction, not a measurement.
Level 02
169 targets state what has to change
Each goal breaks into targets numbered as goal.target. The numbering carries meaning. Numeric targets such as 13.2 or 5.5 are outcome targets: the substantive change being sought. Lettered targets such as 13.a or 5.c are means-of-implementation targets, covering finance, technology transfer, policy and capacity.
The distribution is uneven, and that unevenness is informative. Goal 17 carries 19 targets because it holds all the implementation machinery. Goals 7 and 13 carry five each, despite being the goals most companies report against.
Most corporate reporting maps to outcome targets and quietly skips the lettered ones, which is where a lot of the finance and policy accountability actually sits.
Level 03
234 indicators define the measurement
The global indicator framework is the statistical layer. Following the 2025 comprehensive review by the UN Statistical Commission it contains 251 indicators, of which 234 are unique: two were replaced, six revised and three added to the 231 unique indicators that had applied since 2020.
These indicators were written for national statistical offices, not for companies. Total greenhouse gas emissions per year is a sensible national measure; applied to a single organisation it needs a defined boundary, a consolidation method and a treatment for the value chain before it means anything.
That translation step: global indicator to corporate proxy is where most SDG reporting either becomes credible or quietly falls apart.
How the 169 targets are distributed
Target counts are not evenly spread, and the imbalance is worth knowing before you choose which goals to commit to. The goals with the fewest targets are often the ones with the heaviest corporate reporting load.
Source: the 2030 Agenda for Sustainable Development. Counts include both outcome and means-of-implementation targets and total 169.
Indicator tiers, and why they matter to you
Indicators are classified by tier, which tells you how mature the measurement actually is. This matters when you borrow an SDG indicator for corporate reporting: a tier II indicator has an agreed method but patchy national data, so any target built on it will be hard to benchmark externally.
| Tier | What it means | Practical consequence |
|---|---|---|
| Tier I | Methodology is established and data are regularly produced by at least half of countries in the relevant regions. | Safe to benchmark against national and regional statistics. |
| Tier II | Methodology is established, but data are not regularly produced by countries. | Usable internally; external comparison will be thin or inconsistent. |
| Multi-tier | Different components of the same indicator sit in different tiers. | Disclose which component you are measuring, or the number is ambiguous. |
The full list is maintained by the Inter-Agency and Expert Group on SDG Indicators. See the global indicator framework, the 2025 comprehensive review and the Sustainable Development Goals Report.
How the SDGs relate to ESG and sustainability reporting
The SDGs describe the destination. ESG frameworks describe what you have to file.
This is the distinction most SDG pages skip. The SDGs are a goal framework: they say what the world should achieve. ESG reporting standards are disclosure frameworks: they say what an organisation must publish, in what format, with what assurance. The two are complementary, not interchangeable, and confusing them is why so many SDG sections in annual reports read as decoration. Plenty of other sustainable development frameworks exist, but none has the same universal adoption, which is why the SDGs remain the common reference point.
In practice the overlap is high enough that the same underlying datapoint usually serves both. A verified emissions figure supports ESRS E1, GRI 305 (GRI 102 from 1 January 2027), IFRS S2 and SDG indicator 13.2.2. A gender-split headcount supports ESRS S1, GRI 405, an SFDR principal adverse impact and SDG indicator 5.5.2. The work is not collecting the data twice; it is collecting it once and tagging it against every framework that needs it.
| Framework | What it is | Strongest SDG overlap |
|---|---|---|
| Mandatory EU sustainability reporting standards, built on double materiality. | Goals 5, 8, 12, 13 and 16. Target 12.6 is effectively the policy rationale for CSRD. | |
| Voluntary impact-reporting standards used globally, including a formal SDG linkage. | Broadest coverage of all 17 goals; GRI publishes an explicit goal-to-disclosure mapping. | |
| EU disclosure regime for financial market participants, including principal adverse impacts. | Goals 5, 8, 13, 15 and 16 through the mandatory PAI indicators. | |
| IFRS S1 and S2 (ISSB) | Investor-focused sustainability and climate disclosure, financial materiality only. | Goal 13, with governance and risk elements touching Goals 8 and 16. |
| Classification of environmentally sustainable economic activities. | Goals 6, 7, 11, 12, 13, 14 and 15 through its six environmental objectives. | |
| VSME | Voluntary simplified standard for small and medium-sized enterprises. | Entry point to Goals 5, 8, 12 and 13 without the full ESRS datapoint load. |
Deciding which goals genuinely matter to your organisation is the same exercise as deciding which topics are material. If you have already run a double materiality assessment, the impact side of that assessment is most of the way to a defensible SDG prioritisation, since the material impacts you identified map directly onto goals and targets.
How to measure and report SDG impact
One record per target. That is the whole method.
The distance between “we support the SDGs” and a number someone can audit is a definition problem, not a data problem. Most organisations already hold the underlying figures somewhere. What is usually missing is the decision about which target the figure serves, what boundary it covers, how it was calculated and who owns it.
The practical unit of SDG measurement is one record per target you have committed to. Ten fields, agreed once, reused every cycle. Every goal panel above already gives you the first three fields for its example target.
The measurement record
Capture these ten fields for every SDG target you commit to. The example column follows target 8.7 on forced and child labour through from commitment to disclosure.
| Field | Worked example: target 8.7 | Why it matters |
|---|---|---|
| SDG target | 8.7: eradicate forced labour and child labour | Commitment sits at target level. A goal number alone cannot be audited. |
| Global indicator | 8.7.1: children engaged in child labour | States which UN measure you are approximating, so the gap is visible. |
| Corporate metric | Share of supplier spend covered by labour due diligence, and confirmed findings | The thing you can actually count within your own boundary. |
| Boundary | Tier 1 and tier 2 suppliers in eight priority countries | Without it, year-on-year comparison and peer comparison both fail. |
| Method and source | Audit programme records; spend from the procurement system | Assurance providers test the method, not just the number. |
| Unit | Percentage of spend; count of findings | Mixed units inside one metric are the most common reporting error. |
| Base year and value | 2024: 46% coverage, 12 findings | Progress is meaningless without a fixed starting point. |
| Target and date | 90% coverage by 2028, all findings remediated within 90 days | Separates a commitment from an ambition. |
| Owner | Chief Procurement Officer | A named person, not a function, or nobody is accountable. |
| Framework tags | ESRS S2, GRI 408 and 409, SFDR PAI 11 | One figure, tagged once, satisfies every filing that requests it. |
| Assurance | Limited assurance, FY2026 | Tells the reader how much weight the number can carry. |
Where your number sits on the results chain
Impact measurement has five stages. Most corporate SDG reporting stops at stage three and calls it impact. Knowing which stage a figure belongs to is what stops a reasonable claim becoming an indefensible one. Select a stage.
Input: what you put in
Resources committed: budget, headcount, capital expenditure, management time. Easy to measure and easy to over-claim, because spending money is not the same as changing anything.
Target 8.7 example: €1.4 million allocated to the supplier audit programme, with four full-time staff.
Activity: what you did
The actions those resources funded. Still an internal measure, but it demonstrates the programme exists in practice rather than only in policy.
Target 8.7 example: 46 on-site social audits completed across eight countries, with corrective action plans issued.
Output: what was produced
The direct, countable product of the activity. This is where most SDG reporting stops, and it is a legitimate thing to disclose, provided it is labelled as an output and not described as impact.
Target 8.7 example: 68% of tier 1 and tier 2 supplier spend covered by labour due diligence, up from 46%.
Outcome: what changed for people
The change in conditions for those affected. Harder to measure, usually requiring evidence from the people concerned rather than from your own systems, and the first stage that can honestly be called a result.
Target 8.7 example: 12 confirmed cases remediated, with worker-verified follow-up at 90 days and recruitment fees repaid.
Impact: the change you can claim
The outcome, minus what would have happened anyway. Claiming impact requires a view on the counterfactual, and for most corporate programmes that view is weak. This is why the honest framing is contribution rather than attribution.
Target 8.7 example: a stated contribution to target 8.7 in the named sourcing regions, evidenced by outcome data, not a claim to have moved indicator 8.7.1.
The rule that keeps you credible
Contribution, not attribution
Global indicators move at national scale, driven by government policy, demographics and the wider economy. A single organisation almost never moves one. Saying you contributed to a target, and showing the outcome evidence for your own boundary, is both more defensible and more useful than claiming a share of a national statistic.
Assurance providers and regulators increasingly test impact language directly. “We reduced child labour” invites a question you cannot answer. “We remediated 12 confirmed cases and verified outcomes at 90 days” does not.
What to publish
A short table beats a long narrative
For each prioritised target, publish the corporate metric, the boundary, the base year, current value, target and date, and the assurance level. Six columns. Readers can then compare you year on year and against peers, which a page of narrative and goal icons does not allow.
Keep the method note with the table, not in an appendix. Add the framework tags so a reader arriving from an ESRS, GRI or SFDR perspective can find the same figure without recalculating it.
How Businesses Can Support the SDGs and What It Means for ESG
The Sustainable Development Goals aren’t just a government framework, they’ve become a core reference point for corporate ESG and sustainability strategy. Here’s how the two connect:
A shared reporting language
The SDGs give ESG and CSR reporting a globally recognised structure that stakeholders (investors, regulators, customers and employees) already understand.
Materiality and focus
Rather than trying to address all 17 goals equally, most organisations identify the handful most material to their sector and operations, then align targets and KPIs accordingly.
Risk and opportunity
Mapping operations against the SDGs surfaces both risk exposure (e.g. climate, labour practices) and growth opportunities (e.g. clean energy, circular products).
Stakeholder expectations
Increasingly, SDG alignment is expected alongside or as part of frameworks like the GRI Standards, feeding into wider ESG disclosures and sustainability reports.
Credibility
Grounding sustainability claims in the SDGs’ targets and indicators, rather than vague commitments, supports more credible, defensible reporting.
Building Your SDG Strategy with Impact SDG
Five steps that turn seventeen icons into a measurable plan, and what the platform does at each one.
An SDG strategy sets out which goals an organisation will contribute to, what it will change, how it will measure the change and how it will report it. Governments do the same thing at country level through a national sustainable development strategy. Switzerland’s 2030 Sustainable Development Strategy is a working example of how national priorities are set against the same 17 goals. The corporate version is smaller in scope but structurally identical, and it fails in the same places: prioritisation that is not evidenced, baselines that cannot be reproduced, and reporting that has to be rebuilt by hand every cycle.
Prioritise the goals that are actually yours
Almost no organisation contributes meaningfully to all 17. Start from where your operations, products and value chain create the largest positive and negative impacts, then map those impacts to goals and specific targets. A logistics business will land on Goals 8, 9, 11 and 13. An asset manager will land on Goals 5, 8, 13 and 17 through its portfolio rather than its own footprint.
Prioritise at target level, not goal level. “We support Goal 8” commits you to nothing. “We are working on target 8.7 in tiers one and two of our supply chain” is a statement someone can hold you to.
What Impact SDG does here
The SDG Mapper reads your existing strategy documents, policies and prior reports and shows which goals and targets they already reference, and which they claim without evidence. It is a faster and more defensible starting point than a workshop, because it is grounded in what you have actually written. Try it below.
Baseline against real indicators
For every prioritised target, choose the measure you will actually report. Sometimes the global indicator translates directly. More often it does not, because those indicators are written for national statistical offices, and you need a corporate proxy that is defensible and consistent year on year.
Record the boundary, the method and the data source at the same time as the number. A baseline without a documented method cannot survive a change of team, let alone assurance.
What Impact SDG does here
QB-EDGE collects the underlying figures across entities, sites and suppliers using templates you define, with calculation logic, reporting boundaries and an audit trail attached to every value rather than held in someone’s spreadsheet.
Set targets with dates and owners
The 2030 deadline is the outer boundary, not the plan. Set interim milestones that fall inside normal planning cycles, attach each one to a named accountable executive, and state the base year. Where an external methodology exists (science-based emissions targets, for instance), use it rather than inventing a trajectory.
Be explicit about which targets are commitments and which are ambitions. Regulators and assurance providers increasingly test the difference.
What Impact SDG does here
Targets are held against the same datapoints that produce the disclosure, so progress is calculated rather than restated. When a boundary or method changes, the effect on every dependent target is visible immediately.
Embed it in operating decisions
An SDG strategy that lives only in the sustainability report changes nothing. The connection points that matter are capital allocation, procurement criteria, product design gates, remuneration and risk registers. If a supplier can fail a commercial review on a Goal 8 criterion, the strategy is operational. If not, it is communications.
This is also where national and corporate strategies meet: public procurement rules in many jurisdictions now encode SDG-aligned criteria directly.
What Impact SDG does here
Supplier questionnaires are issued, chased and scored against the targets you prioritised, so procurement decisions draw on the same evidence base as the report rather than a parallel one.
Report once, against every framework
The same datapoint will be requested by your CSRD filing, your investors’ SFDR templates, a customer questionnaire, a rating agency and your SDG narrative, each in a different format. Collect it once, tag it against every framework that needs it, and generate the outputs from a single set of figures.
That tagging model is what separates an SDG strategy you can keep running from one that gets rebuilt manually every reporting cycle.
An effective SDG strategy typically follows a similar path, whether it’s built at national or organisational level:
Map
Step 01: prioritisation
Upload a document in your working language and see which goals, targets and indicators it references, with every mention traceable back to its position in the source text.
SDG MapperMeasure
Steps 02 to 04: baseline and targets
Collect the underlying figures once across entities, sites and suppliers, with defined boundaries, calculation logic and an audit trail attached to every value.
QB-EDGEReport
Step 05: disclosure
Produce SDG narrative, ESRS datapoints, GRI indices and SFDR templates from the same numbers, so the story and the filing cannot drift apart.
ESRSStart with SDG Mapper
Step one is prioritisation, and the fastest defensible way through it is to read what you have already written. SDG Mapper analyses a document and evaluates its alignment with the Sustainable Development Goals, so your starting position comes from evidence rather than from a workshop.
What it does
- Upload a policy, strategy, project document, research paper or prior report, and select its language
- The system reads the content and highlights SDG mentions and related material, resolving goals, targets and indicators
- Results are visualised through SDG colour-coded graphs
- A reference tracker shows exactly where in the document each keyword appears, so findings stay traceable to source
- Save, revisit or download the mapping, including a print-ready version
Built on the SDG Mapper methodology developed and maintained by the European Commission’s Joint Research Centre, used without modification to its underlying method.
Where it fits in the five steps
Step 01: prioritise
Shows which goals and targets your existing documents already reference, and which are claimed without supporting detail.
Step 02: baseline
Resolved targets and indicators give you the first three fields of the measurement record for every target you keep.
Ready to build your SDG strategy?
Get in touch with our team to see how Impact SDG can support your organisation.
Request demo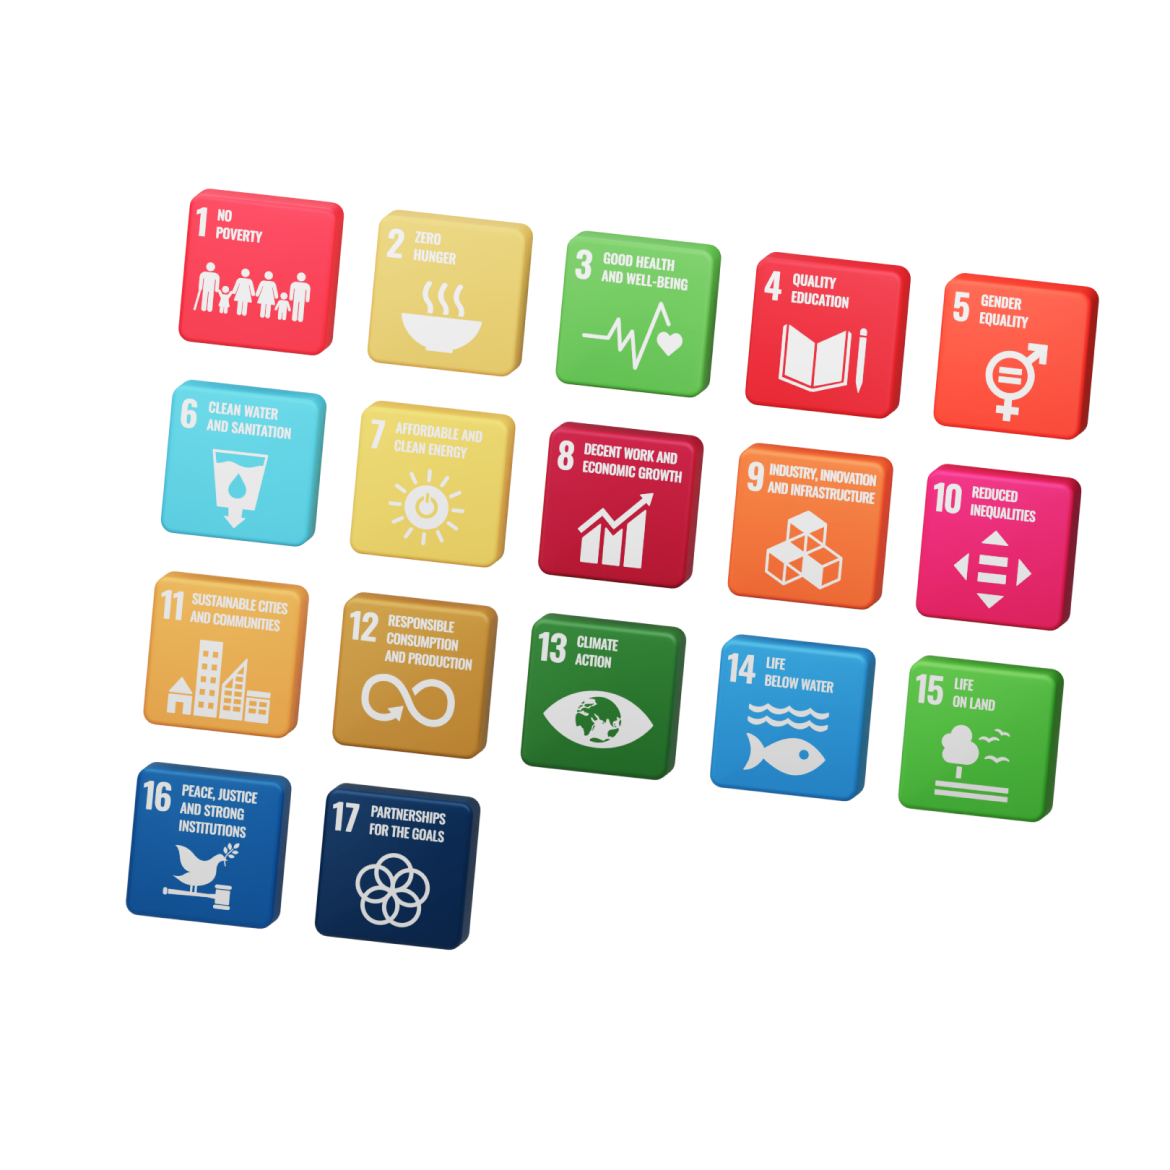
Frequently Asked Questions
What are the Sustainable Development Goals (SDGs)?
The Sustainable Development Goals are 17 objectives adopted by all United Nations Member States in 2015 as part of the 2030 Agenda for Sustainable Development. They set out a shared plan for ending poverty, protecting the planet and improving health, education and equality by 2030, and they apply universally to every country rather than only to developing economies.
How many Sustainable Development Goals are there?
There are 17 Sustainable Development Goals. Beneath them sit 169 targets and, following the 2025 comprehensive review of the global indicator framework, 234 unique indicators within a total list of 251.
Who created the Sustainable Development Goals?
They were negotiated by United Nations Member States through an Open Working Group process and adopted unanimously by the UN General Assembly in September 2015, in the resolution “Transforming our world: the 2030 Agenda for Sustainable Development”. They succeeded the Millennium Development Goals, which ran from 2000 to 2015.
What are the targets of the Sustainable Development Goals?
The 169 SDG targets are the specific outcomes that sit beneath each goal, numbered as goal.target, for example 13.2 or 5.5. Numbered targets describe the outcome being sought. Lettered targets, such as 13.a, cover the means of implementation: finance, technology transfer, policy and capacity-building. Goal 17 carries the most targets at 19; Goals 7 and 13 carry the fewest at five each.
What are SDG indicators?
SDG indicators are the statistical measures used to track progress against each target. They are maintained by the Inter-Agency and Expert Group on SDG Indicators and classified by tier according to whether an agreed methodology exists and whether countries produce the data regularly. Indicators are refined annually and comprehensively reviewed periodically, most recently in 2025.
How are the Sustainable Development Goals measured?
Progress is measured at national level through the global indicator framework, compiled by national statistical offices and published in the UN Global SDG Indicators Database. Countries also report voluntarily to the High-Level Political Forum. Organisations measure their own contribution by selecting the targets relevant to them and defining corporate proxies for the global indicators, since those indicators are designed for national statistics rather than company boundaries.
How can businesses support the Sustainable Development Goals?
By identifying where their operations, products and value chain create the largest impacts, committing to specific targets rather than whole goals, measuring against defined indicators, and embedding those commitments in procurement, capital allocation and remuneration. Target 12.6 also makes sustainability reporting itself a direct contribution, which is why a CSRD or GRI disclosure counts against the framework.
How do the Sustainable Development Goals relate to ESG?
The SDGs are a goal framework describing what the world should achieve; ESG standards such as ESRS, GRI, SFDR and IFRS S1 and S2 are disclosure frameworks describing what an organisation must publish. They overlap heavily at datapoint level: a verified emissions figure serves ESRS E1, GRI 305 (GRI 102 from 1 January 2027), IFRS S2 and SDG indicator 13.2.2 simultaneously. The efficient approach is to collect each figure once and tag it against every framework that requires it.
How do organisations align with the Sustainable Development Goals?
Alignment normally follows five steps: prioritise the goals and targets that reflect genuine impacts, baseline current performance against defined indicators, set dated targets with named owners, embed those targets in operating decisions such as procurement and capital allocation, and report against every framework from a single set of figures. Prioritisation is most defensible when it draws on an existing double materiality assessment.
What is an SDG strategy?
An SDG strategy is a documented plan setting out which Sustainable Development Goals and targets an organisation will contribute to, what it will change, how it will measure that change and how it will report progress. A credible one commits at target level rather than goal level, states base years and interim milestones, and assigns accountability to named executives.
What is a national sustainable development strategy?
It is a country-level plan that translates the 2030 Agenda into national priorities, policy measures and monitoring arrangements. Switzerland’s 2030 Sustainable Development Strategy is a current example, setting national focus areas against the same 17 goals. Countries report progress through Voluntary National Reviews at the UN High-Level Political Forum.
Why are the Sustainable Development Goals important?
Because they are the only impact framework that governments, development banks, investors, rating agencies and corporate clients all recognise. That shared vocabulary is what allows a company disclosure, a fund prospectus and a national development plan to be compared against the same reference points, and it is why SDG alignment increasingly appears in procurement criteria and sustainable finance documentation.


ISO/IEC 27001:2022 certified · Licensed by GRI · Licensed by the IFRS Foundation: ISSB® Standards Inside · Member of Swiss Sustainable Finance and Eurosif · Friend of EFRAG
IFRS® and ISSB® are registered trade marks of the IFRS Foundation and are used under licence. The ISSB Standards Inside logo is used under licence from the IFRS Foundation.
Related articles
 Read more: EU Digital Action Plan for the Water Sector
EU Digital Action Plan for the Water Sector
 Read more: Impact measurement challenges: what the SSF Spotlight paper reveals
Impact measurement challenges: what the SSF Spotlight paper reveals
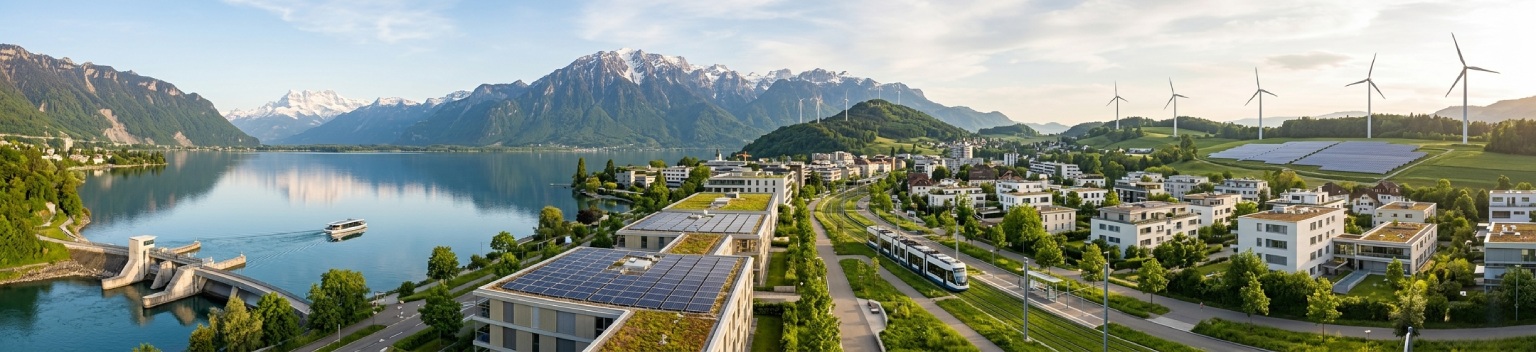 Read more: Switzerland 2030 Agenda SDG
Switzerland 2030 Agenda SDG