ESG data from your portfolio companies
One questionnaire, every company, every period.
QB-EDGE™ by Generation Impact Global (GIG), Geneva, is ESG data collection and questionnaire software. Fund managers and private equity teams can use it to send one questionnaire to every portfolio company, review each submission and calculate KPIs per company.
Explore QB-EDGE™
QB-EDGE™
The problem
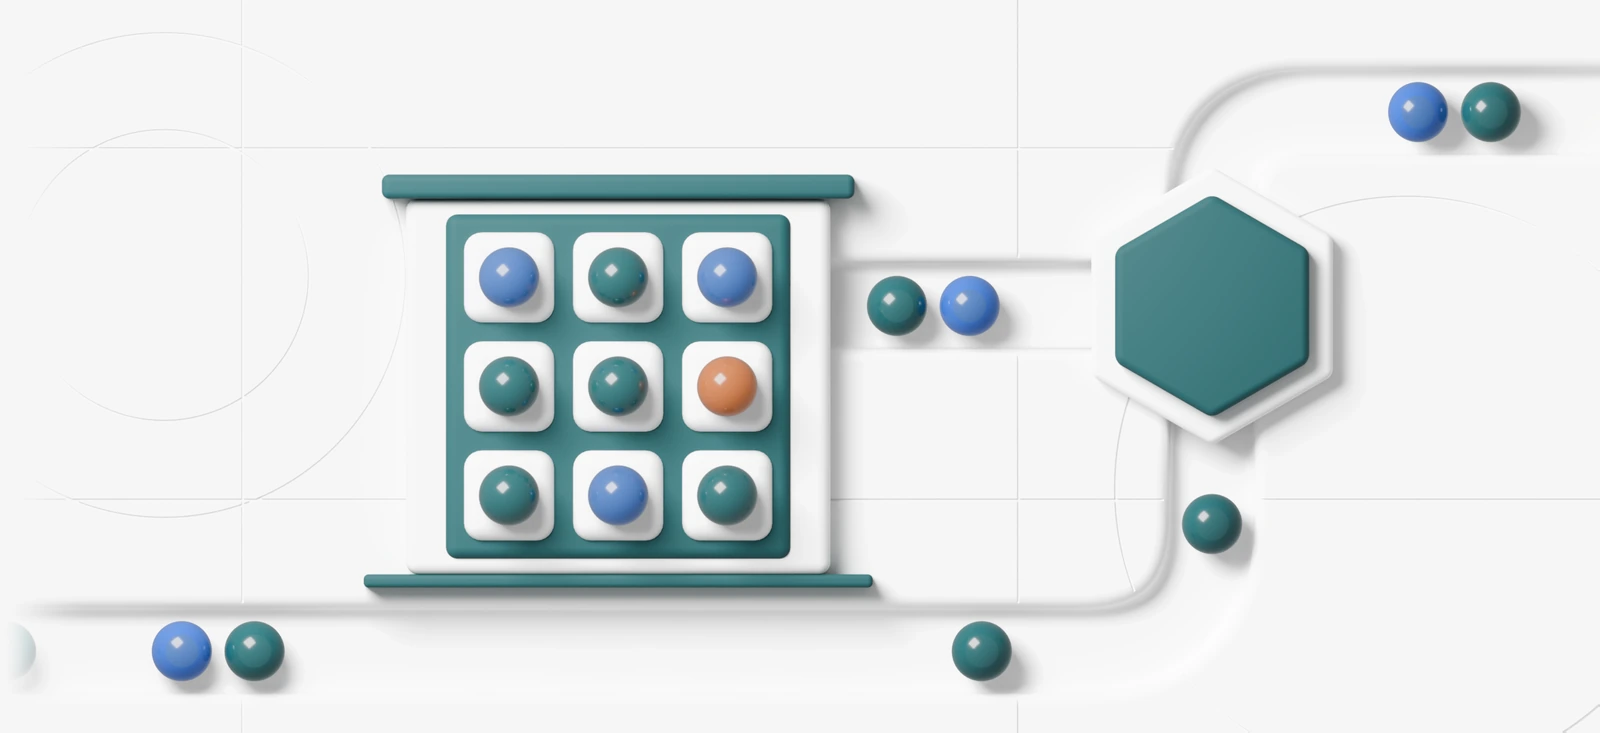
Data by email and spreadsheet
Three places where the figures go wrong
- Different spreadsheets. Each portfolio company sends its own file, in its own layout.
- Figures you cannot compare. The questions change from one year to the next, so the numbers do too.
- No record of corrections. A value is changed after a call, and later nobody can say when or why.
How to set it up in QB-EDGE™
Six steps, from the first template to the Excel file. This page is an example set-up. It shows how the product can be configured and does not describe a named customer.
Drafting from a description
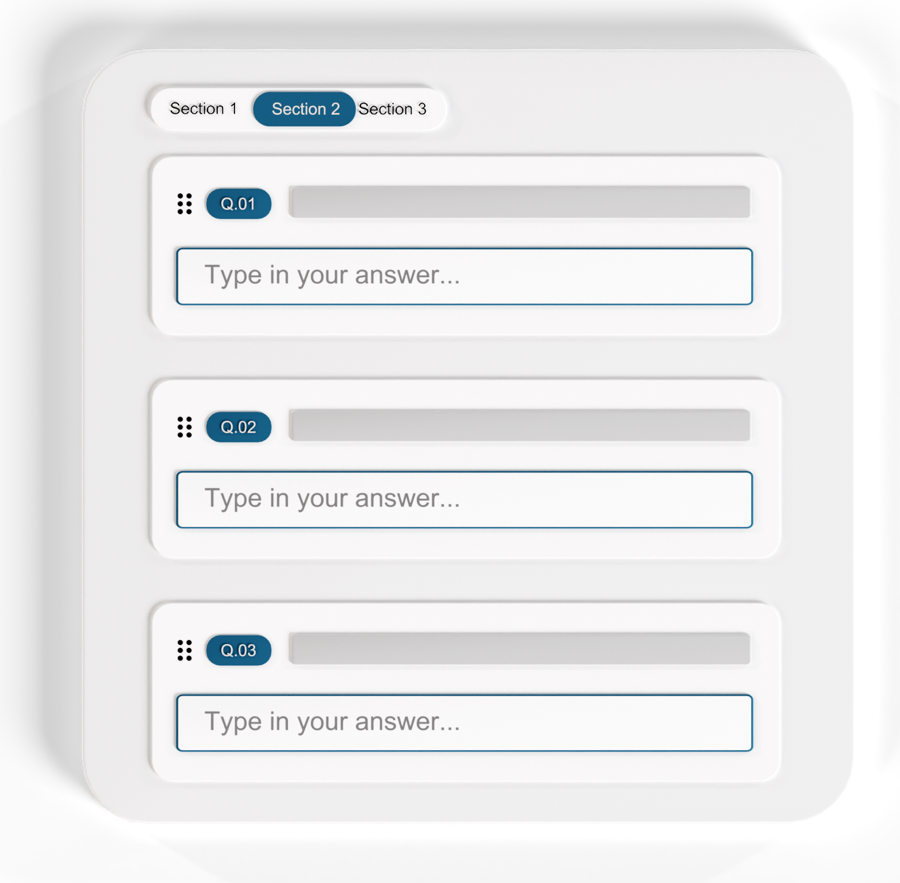
1. Build or copy the template
Start from the file you already have
Upload last year’s questionnaire as a PDF, Word, Excel or CSV file, and VitAI™ copies it into a template. Or describe a new one and VitAI™ drafts the questions. You review everything in the editor.
2. Make it recurring and send it
The same questions, every period
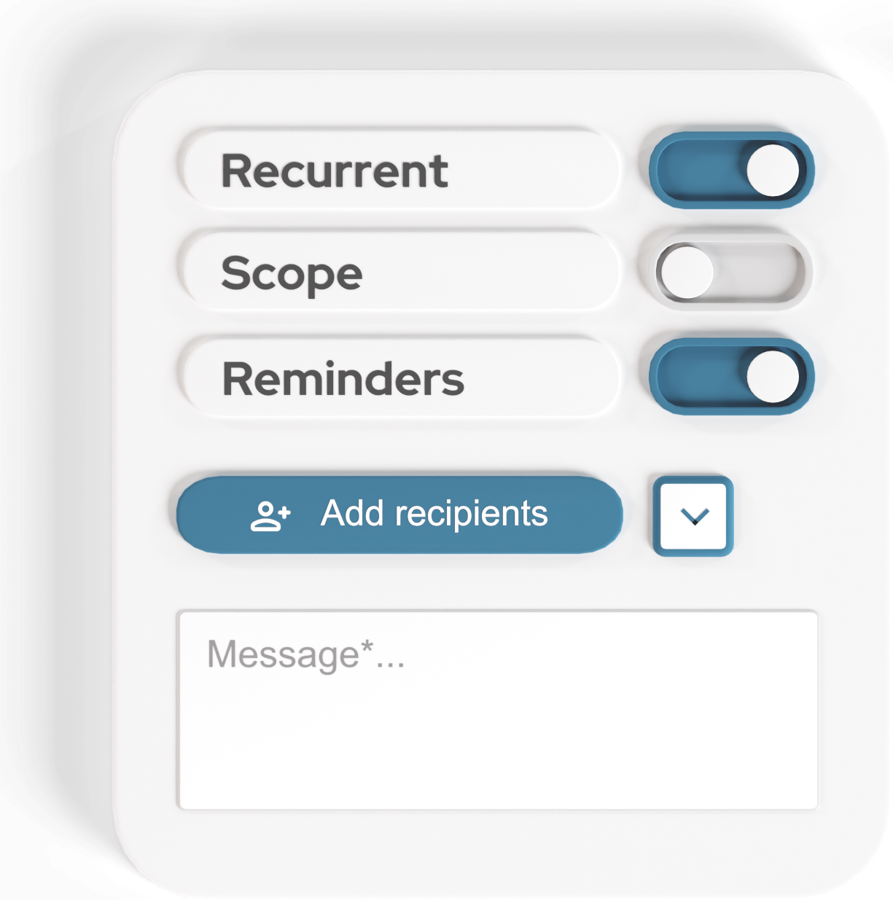
Choose a rhythm: monthly, quarterly, half-yearly or yearly. The next period is created for you. Switch on comparison, and last period’s values appear beside the current ones.
Then send it to your portfolio companies. Set a deadline, and add reminders a set number of days before it. QB-EDGE™ emails each reminder to the companies that have not yet submitted. A holding can let its funds send the questionnaire themselves.
3. Review every submission
Approve it, or send it back with notes
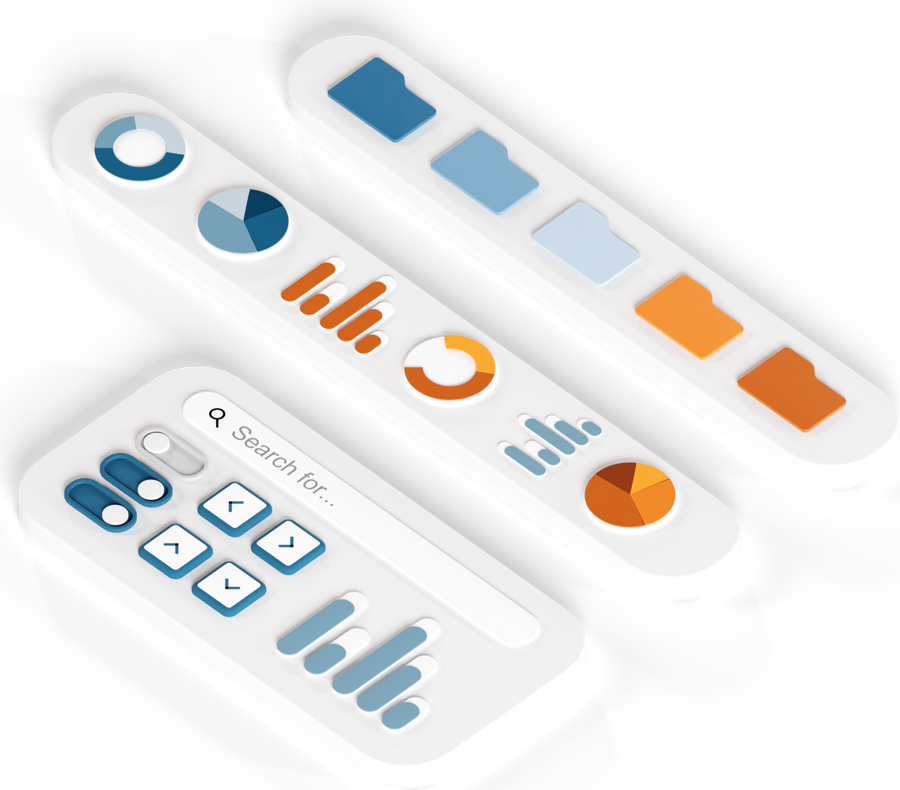
Read each company’s answers. Flag the questions that need work, add a note to each, then approve or reject. The company sees your notes and can send a corrected version.
4. Let formulas calculate the KPIs
One formula, applied to every company
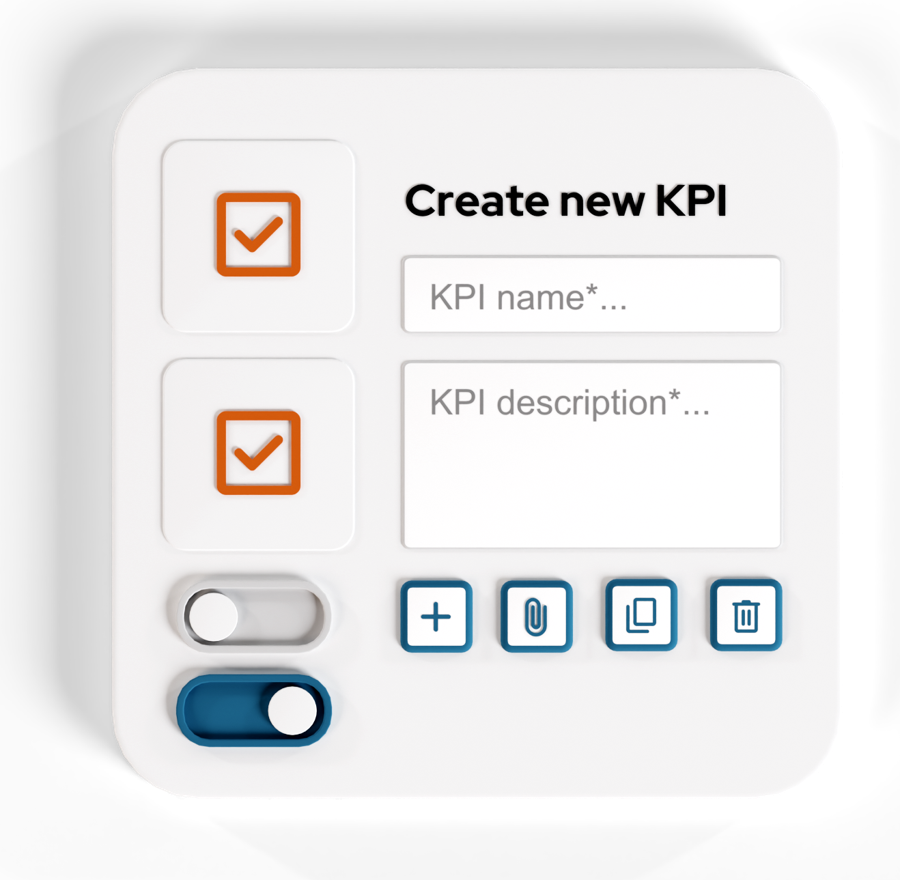
A KPI copies one answer or calculates a spreadsheet-style formula over several, from the current or the previous period. Each KPI has a unit, and the formula is checked before you save.
Building a KPI formula
From answer weights to the Benchmark
5. Benchmark by sector
Each company sees only its own position
Put a weight on answer options to get a score per company. The Benchmark averages the questionnaires you have accepted, across the whole panel and per group. You choose the single choice question that sets the group, for example the sector. If you switch visibility on, each company sees its own score beside the averages, never another company’s.
6. Export to Excel
Take the figures with you
Results, a single company’s answers and the Benchmark all export to Excel.

From screening to monitoring: one tool, three questionnaires
A fund can use QB-EDGE™ at three stages of an investment, with one questionnaire for each: a short one before investing, a detailed one for due diligence and a recurring one afterwards.
Pre-investment screening
A quick first look at a target company, on the same questions each time.
- One-off questionnaire. Send it once, to a company or to an external contact by email.
- Conditions. A question appears only when an earlier answer calls for it, so each company answers only what applies to it.
- Answer weights. Weights on answer options give each company a score in the Benchmark, once you accept its questionnaire.
Example: 15 yes/no and single choice questions on policies, energy data and governance.
Adding a condition
Due diligence
Detailed answers, the documents behind them and a record of each round.
- Evidence files. Respondents can attach evidence files to an answer.
- Review and correction. Flag the questions that need work, add a note to each and send them back. The company can send a corrected version.
- History log. It lists each submission, rejection and approval.
Example: 80 questions in six sections, with follow-up questions shown only where the answer is yes.
Reviewing a submission and asking for a correction
Post-investment monitoring
The same figures from every portfolio company, each period.
- Recurring questionnaire. Monthly, quarterly, half-yearly or yearly. Switch on comparison, and last period’s values appear beside the current ones.
- KPIs. Calculated per company by your own formulas.
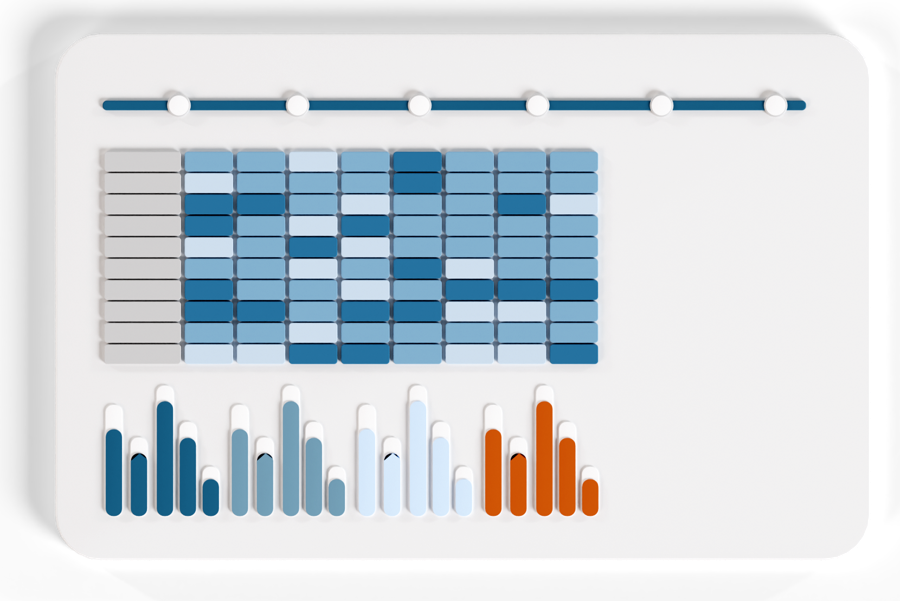
- Benchmark and Excel. The Benchmark averages the scores of the questionnaires you have accepted, across your own panel. Results export to Excel.
Example: A yearly questionnaire on energy, emissions, workforce and governance, sent to every portfolio company.
Comparing with the previous period
QB-EDGE™ collects and documents the answers and calculates scores by your weights and KPIs by your formulas. The investment decision and the legal assessment stay with you.
What you get
Figures you can compare and explain
- Comparable figures. The same questions return each period, with last period’s values beside them.
- A record of each round. The history log keeps each submission, rejection and approval. Each answer keeps its version history.
- KPIs and scores per company. KPIs come from your formulas, scores from answer weights. Both export to Excel.
Frameworks. Map your questions to GRI, ESRS, SASB, SFDR and VSME items. GRI and ESRS disclosures can be imported as ready-made questions.
Some features depend on your plan. See pricing.
Questions funds ask about QB-EDGE™
How do private equity funds collect ESG data from portfolio companies?
One way is a questionnaire sent to each portfolio company at a fixed rhythm, with the same questions each period so the figures can be compared. QB-EDGE™, made by Generation Impact Global, lets you set a recurring questionnaire: monthly, quarterly, half-yearly or yearly. The next period is created automatically. You approve each submission or send it back with notes, and KPIs are calculated from the answers.
Can a fund use QB-EDGE™ for an ESG due diligence questionnaire?
Yes. A fund can send a due diligence questionnaire in QB-EDGE™ once, to a company or to an external contact by email. Respondents can attach evidence files, and the fund reviews each submission, then makes its own assessment.
Can we screen a target company before investing?
Yes. In QB-EDGE™ you can send a target company a short questionnaire with weights on the answer options. Once you accept its answers, the Benchmark shows its score by your weights, and the decision to invest stays with you.
Can portfolio companies see each other’s results?
No. In QB-EDGE™ the Benchmark is not shown to companies unless you switch visibility on. When it is on, each company sees its own score beside the panel average and its group average. It never sees another company’s name or score.
Can we compare this year with last year?
Yes. QB-EDGE™ has a “Comparability with previous period” option for recurring questionnaires. When it is on, last period’s values appear beside the current ones, for the companies answering and in your results. A KPI formula can also use answers from the previous period.
Can AI draft the questionnaire or the answers?
Yes, both. In QB-EDGE™, VitAI™ copies a questionnaire from a file you already have, or drafts one from your instruction, up to 150 questions in a run. Portfolio companies can add their documents and let VitAI™ draft answers, each shown beside the passage it came from. Nothing is saved until a person applies it in the review.
Which formats can we export?
Excel. QB-EDGE™ exports results for the companies you select, a single company’s answers, and the Benchmark.
Other ways teams use QB-EDGE™
- Corporates: sustainability data from suppliers and business units
- Banks: sustainability data from the companies you finance
- Awards and ratings: score applicants with weighted questions
- Analyse and export: scores, the Benchmark, KPIs and Excel export
Back to the QB-EDGE™ overview.
See it with your own questionnaire
Open a free account, or ask us for a walk-through.
Stay up to date
Keep up with changes on policies, legislations and technologies.
 Read more: European Banking Authority Backs NGFS Energy Transition Declaration at COP31
European Banking Authority Backs NGFS Energy Transition Declaration at COP31
 Read more: SEC Proposes Principles-Based Executive Compensation Disclosure Reforms
SEC Proposes Principles-Based Executive Compensation Disclosure Reforms
 Read more: European Commission opens consultation on limited assurance standards for sustainability reporting
European Commission opens consultation on limited assurance standards for sustainability reporting