6Step 6 of 6
Analyse and export results in QB-EDGE™
Answers become figures. Figures go to Excel.
Analyse and export is the part of QB-EDGE™ by Generation Impact Global (GIG) that turns questionnaire answers into figures. QB-EDGE™ calculates scores, a Benchmark and KPIs, shows them in results views and tables, and exports them to Excel. It is built for teams that send questionnaires to portfolio companies, suppliers or borrowers and need to compare what comes back.
Explore QB-EDGE™
At a glance
4
results views
By question, by respondent, by KPIs, comparative.
5
chart types per question
Bar, donut, line, radar, word cloud.
0 to 100
score scale
When weights run from 0 to 100.
Excel
exports (XLSX)
Results, one respondent’s answers, the Benchmark.
What can you analyse in QB-EDGE™?
QB-EDGE™ gives you five ways to read the answers to a questionnaire. Scores and KPIs are calculated by rules you set.
| Output | What it is | Calculated from |
|---|---|---|
| Score | A number for each respondent | The weights you put on answer options |
| Benchmark | The average score of your panel, overall and per group | The questionnaires you have accepted |
| KPI | A figure with a unit, for each respondent | One answer, or a formula over several answers |
| Results views | Answers by question, by respondent, by KPIs or side by side | The answers to one questionnaire |
| Results tables | Your own tables in the Analytics area, with thresholds | The questions and formulas you choose |

Which result views does QB-EDGE™ have?
Four views, one set of answers
QB-EDGE™ shows the answers to a questionnaire in four views.
- By question: every answer to the same question, as a bar, donut, line, radar or word cloud chart.
- By respondent: all answers from one respondent.
- By KPIs: the KPIs of each respondent.
- Comparative view: the same questions, with respondents side by side.
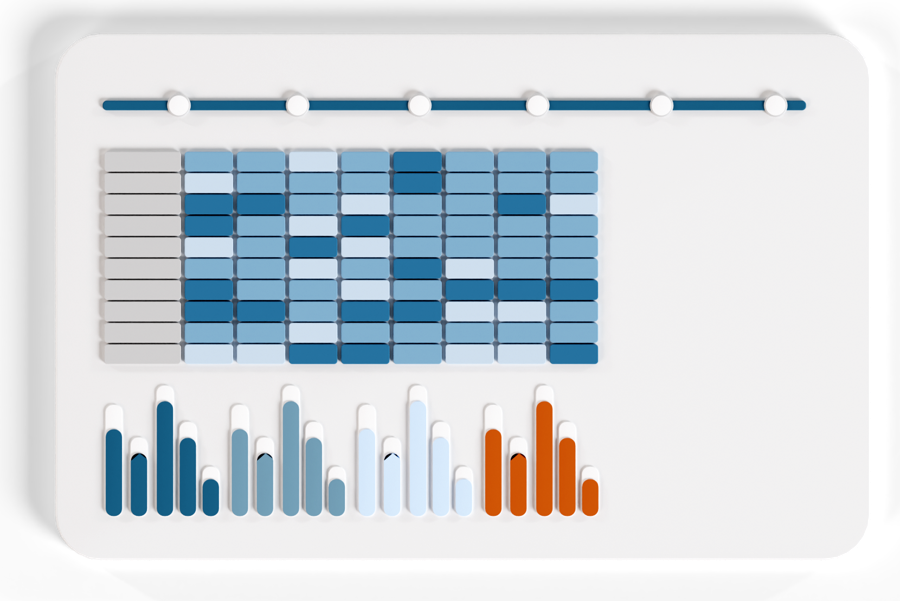
How do weights become a score?
You set the weights, QB-EDGE™ calculates the score
QB-EDGE™ calculates a score from the weights you put on answer options. An option without a weight stays out of the score.
- Single choice and multiple choice: one weight per option.
- Yes/no: one weight for the positive answer and one for the negative.
- Multiple choice: the highest weight among the chosen options counts.
- Scale: with weights from 0 to 100, scores read on a 0 to 100 scale.
How does the Benchmark work?
Compare within your own panel
The Benchmark in QB-EDGE™ is the average score of your own panel: the companies that answered your questionnaire. It uses no outside market data.
- What counts: only questionnaires you have accepted.
- Groups: averages for the whole panel and per group, for example per sector. The group comes from a single choice question.
- Levels: averages per question, per section and overall.
- Empty answers: skipped or counted as zero. You choose.
- Views: a matrix or a table by question, with up to eight colour ranges.
- Visibility: off until you switch it on. Once its questionnaire is accepted, each company sees its own score beside the panel and group averages, and never another company’s score.
- Preview as company: check what one company would see before you switch visibility on.
From answer weights to the Benchmark
How do KPIs work in QB-EDGE™?
Your formulas, calculated for every respondent
A KPI in QB-EDGE™ is a figure calculated from questionnaire answers, for example a renewable energy share in %. QB-EDGE™ calculates it for every respondent.
- Two methods: copy the value of one question, or write a formula over several questions.
- Formulas: spreadsheet-style, with functions such as IF, SUM and ROUND.
- Periods: a formula can use answers from the current or the previous period.
- Units: each KPI has a unit of measure.
- Check: the formula is checked before you save.
- Respondents: you can show a KPI inside the questionnaire and let respondents add an explanation.
Building a KPI formula
How do results tables and thresholds work?
Build the table you need, let colour flag the values
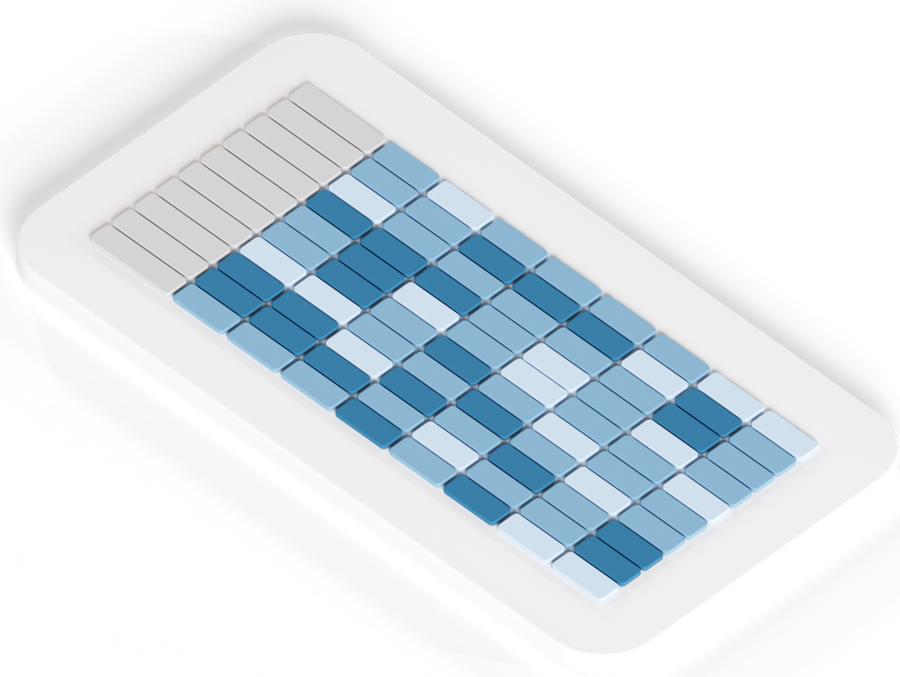
The Analytics area of QB-EDGE™ holds your own pages, and each page holds results tables. You choose the rows, and thresholds colour the values.
- Rows: a question or a formula.
- Thresholds: value ranges, each with a colour and a label such as “Low” or “High”. A value in a range takes its colour.
- Aggregate columns: with a breakdown of what went into each figure, and an optional grand total.
- Filters: tags and categories filter the rows.
- Palettes: save colour palettes and reuse them.
A results table with thresholds
Worked example: renewable energy share
Example with fictional data. The six companies do not exist.
- The questionnaire asks each company for its total energy use and its renewable energy use, in MWh.
- A formula row in a QB-EDGE™ results table calculates: renewable energy share = renewable energy / total energy × 100.
- Two thresholds are set on that row: 0 to 20 is “Low” (red) and 50 to 100 is “High” (green).
| Company | Total energy (MWh) | Renewable (MWh) | Renewable share |
|---|---|---|---|
| Demo company A | 8,400 | 2,940 | 35% |
| Demo company B | 3,900 | 585 | 15% Low |
| Demo company C | 1,150 | 690 | 60% High |
| Demo company D | 12,600 | 2,270 | 18% Low |
| Demo company E | 210 | 168 | 80% High |
| Demo company F | 760 | 532 | 70% High |
Result: two companies show as Low and three as High. Company A, at 35%, sits between the two ranges and has no colour. The clip above shows the same figures in QB-EDGE™.
Can you compare reporting periods?
This period next to the last one
Yes. For a questionnaire that recurs, QB-EDGE™ puts the previous period next to the current one.
- Setting: switch on “Comparability with previous period” when you set up a recurring questionnaire.
- Respondents: “Previous period reported” sits beside each answer. On number questions, the change shows in per cent.
- Results: previous values appear next to the current ones.
- KPIs: a formula can use answers from the previous period.
- Results tables: a table can compare with the previous period or the previous questionnaire.
- Frequency: a questionnaire can recur annually, semi-annually, quarterly or monthly.
Comparing with the previous period
What can you export to Excel?
Take the figures with you
QB-EDGE™ exports to Excel (XLSX). There is no PDF export. You can export three things, and which features you get depends on your plan.
- Results for the respondents you select: answers, rows per location and KPIs.
- One respondent’s answers: from the overview.
- The Benchmark.
Exporting results to Excel
Questions about analysing and exporting in QB-EDGE™
Which result views does QB-EDGE™ offer?
QB-EDGE™ offers four result views: by question, by respondent, by KPIs and a comparative view. You can also build your own tables from questions and formulas.
How are scores calculated in QB-EDGE™?
QB-EDGE™ calculates scores from the weights you put on answer options in single choice, multiple choice and yes/no questions. An option without a weight stays out of the score.
What is a KPI in QB-EDGE™?
A KPI in QB-EDGE™ is a figure with a unit, calculated from questionnaire answers. It copies one answer or uses a spreadsheet-style formula over several.
Can a KPI use last period’s values?
Yes. A KPI formula in QB-EDGE™ can use answers from the current or the previous period.
Which answers count in the Benchmark?
Only questionnaires you have accepted. The QB-EDGE™ Benchmark uses your own panel, with no outside market data.
Can companies see each other’s results?
No. Benchmark visibility in QB-EDGE™ is off by default. If you switch it on, each company sees its own score beside the averages, never another company’s.
What do thresholds do?
Thresholds colour the values in your QB-EDGE™ results tables by the ranges you set, so high and low values stand out.
Can I filter what a table shows?
Yes. In QB-EDGE™ results tables, tags filter the rows, and you choose which questions and formulas each table holds.
Can I compare results with the previous period?
Yes. For a recurring questionnaire, QB-EDGE™ can show previous-period values next to the current ones. You switch the comparison on for the series.
Which formats can I export to?
QB-EDGE™ exports to Excel only. There is no PDF export. You can export results for the respondents you select, one respondent’s answers and the Benchmark.
Does QB-EDGE™ use AI to calculate scores or KPIs?
No. QB-EDGE™ calculates scores from the weights you set and KPIs from the formulas you write.
Open a free account, or ask us for a walk-through.
Some features depend on your plan. See pricing.
Stay up to date
Keep up with changes on policies, legislations and technologies.
 Read more: European Banking Authority Backs NGFS Energy Transition Declaration at COP31
European Banking Authority Backs NGFS Energy Transition Declaration at COP31
 Read more: SEC Proposes Principles-Based Executive Compensation Disclosure Reforms
SEC Proposes Principles-Based Executive Compensation Disclosure Reforms
 Read more: European Commission opens consultation on limited assurance standards for sustainability reporting
European Commission opens consultation on limited assurance standards for sustainability reporting